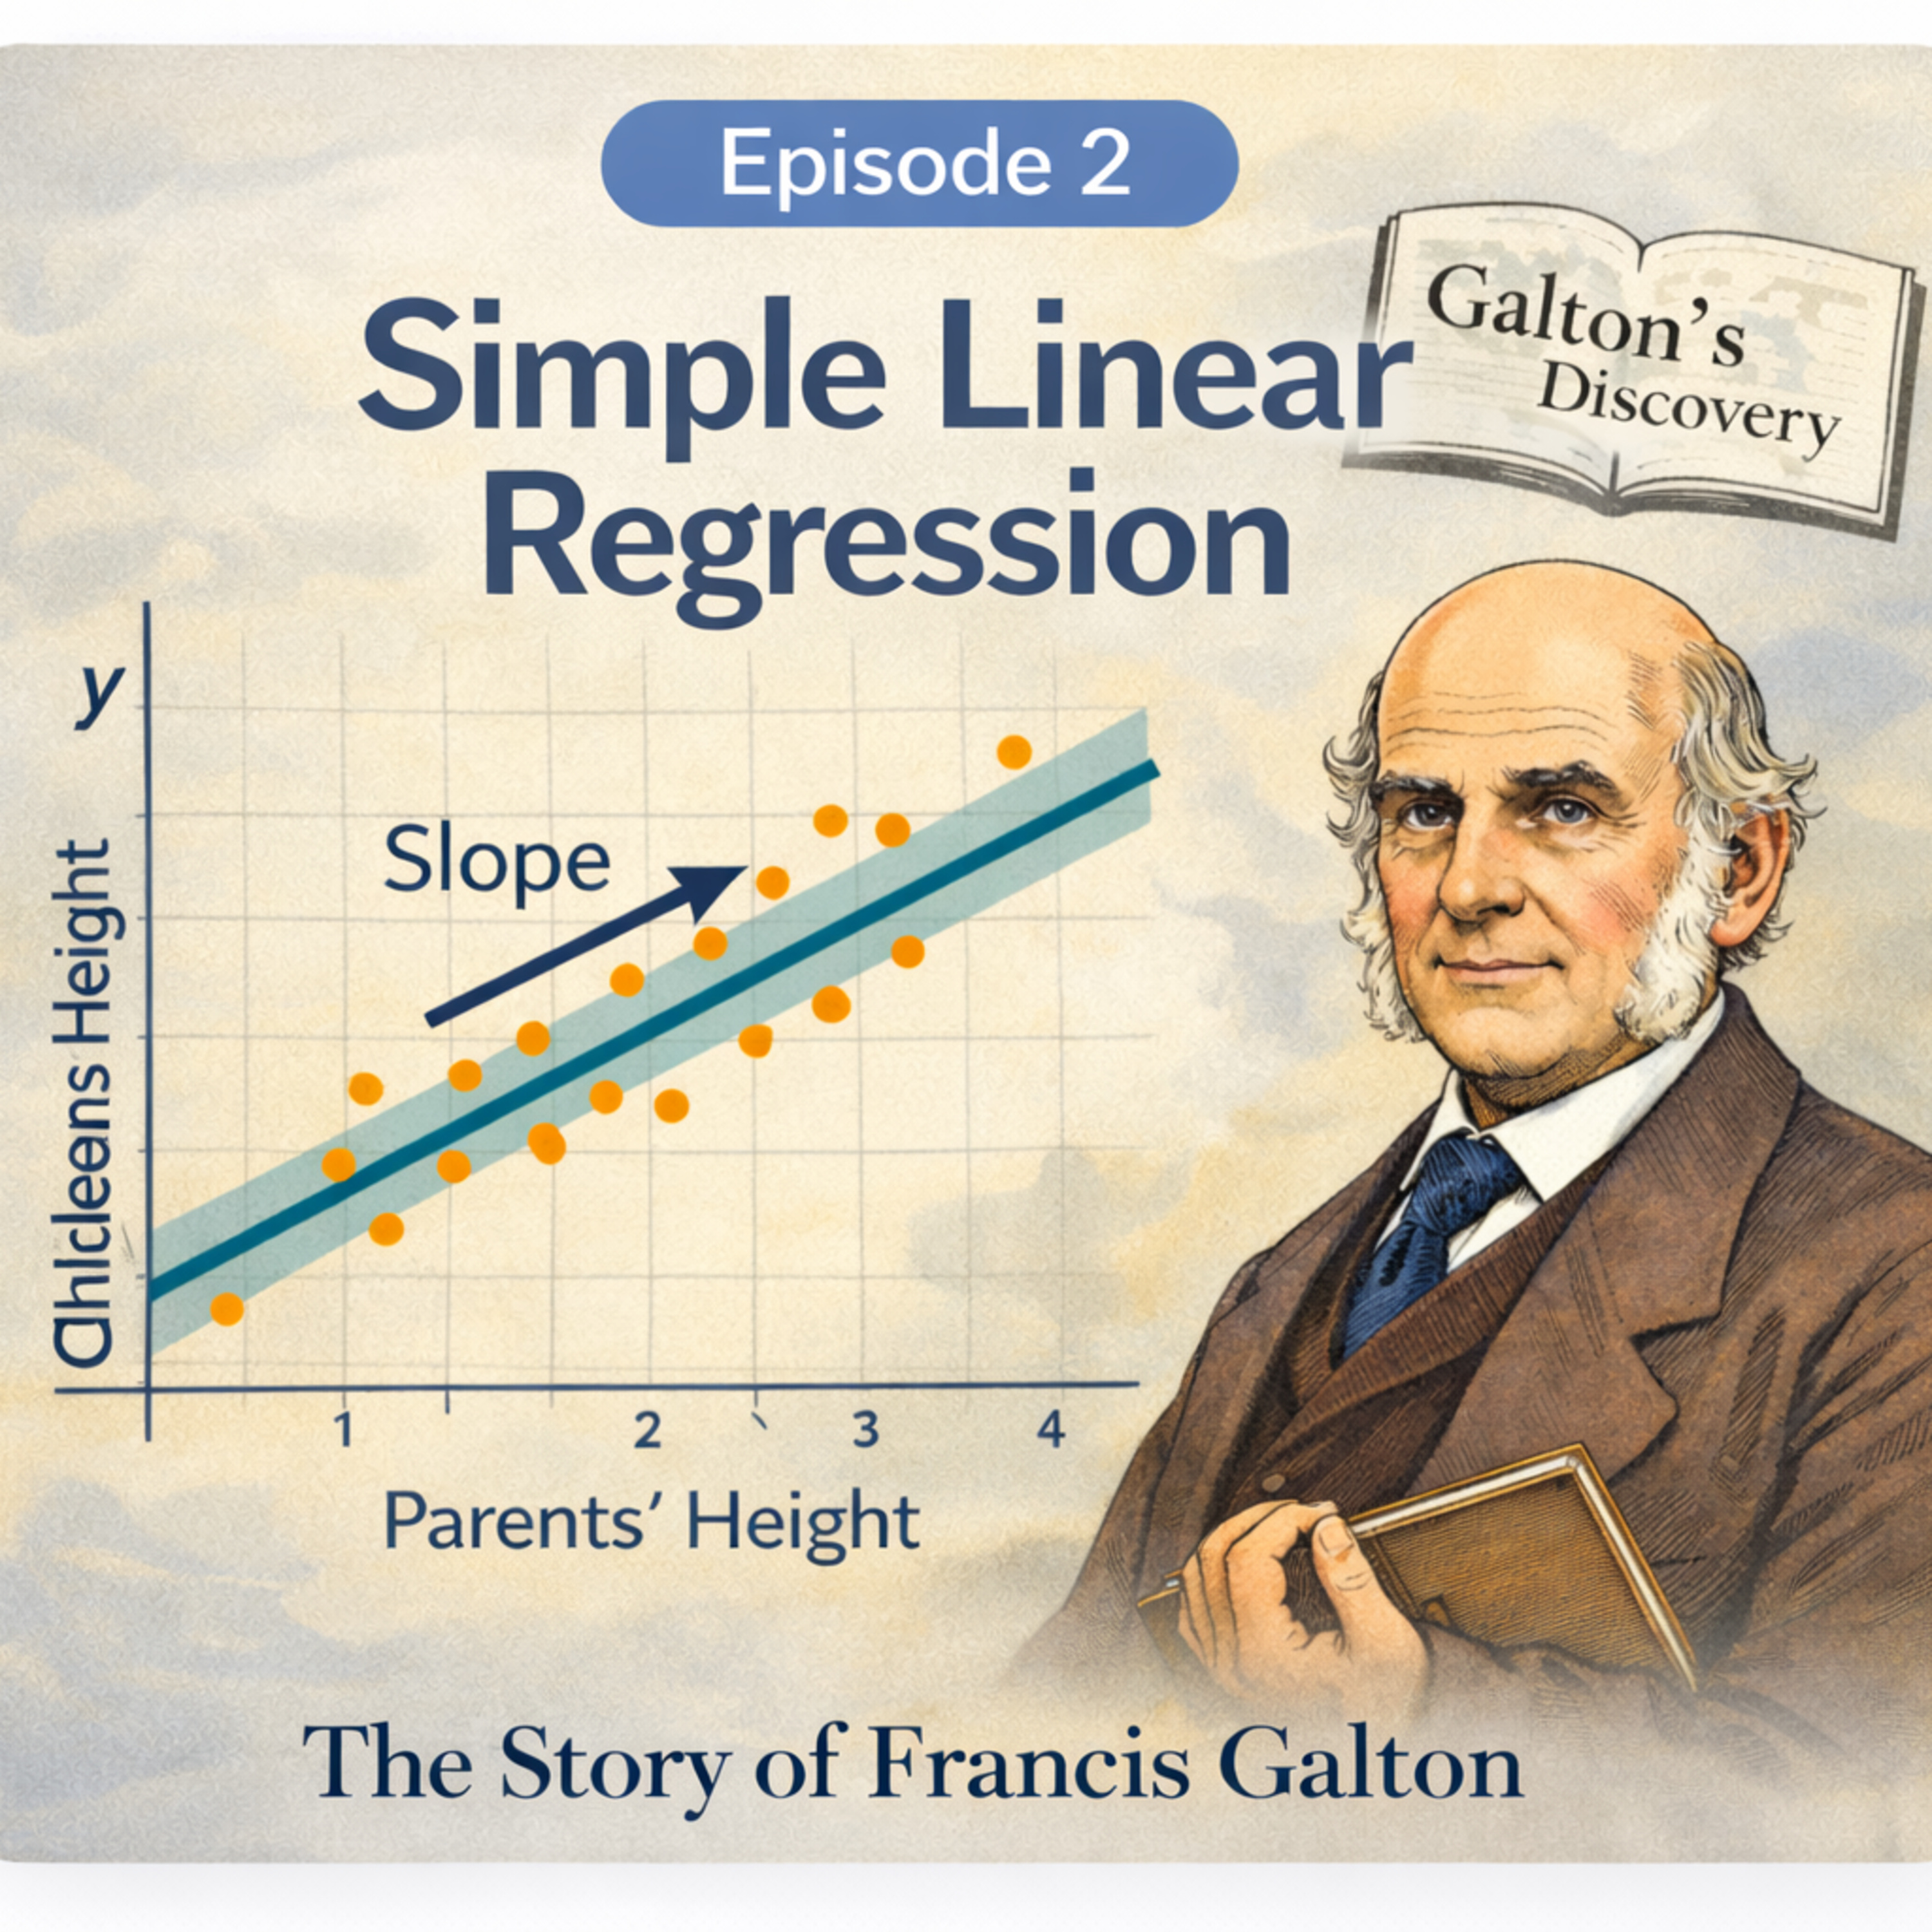
This episode introduces simple linear regression as a tool for understanding trends and making predictions from data. We begin with the historical insight of Francis Galton, whose study of the relationship between parents’ and children’s heights helped popularize the idea of describing association with a straight line.
Building on this intuition, we explain the meaning of the slope and intercept in practical terms, and how they connect to interpretation and prediction. We then emphasize why it is important to check whether a linear model is appropriate before trusting it—using scatter plots and residual plots to detect nonlinearity, unequal variability, and unusual observations.
Finally, we discuss how to judge whether the model is actually useful: how much it explains the variation in the data, what to look for in common regression output, and how these ideas translate into practice through simple examples.