Treasury formally fired the starter’s gun on the economic and fiscal debates in Election 2026 today, publishing its statutorily required opening-of-the-books in the form of the Pre-Election Fiscal Update or PREFU.
It’s supposed to give all the parties the same level playing field of economic and budget assumptions from which to formulate (hopefully) coherent and legally sound sets of policies. It’s supposed to enable voters to compare apples with apples, without having to worry about parties using wild and sneaky assumptions to make their policies look good. It’s also supposed to remove or at least reduce some of the risks that a winning Government can dump its promises straight after the election because it ‘opened the hood and found the previous owner had blown the engine’.
Treasury’s PREFU 2026 appeared to deliver some ‘good’ news for the incumbent Government, and most other initial reports have focused on the earlier surpluses and lower borrowing as a boost for the Government. RNZ reported the PREFU’s lower deficits and bigger forecast surpluses had given Finance Minister Nicola Willis a ‘pre-election reprieve.’ Stuff referred to ‘less debt, bigger surplus coming in PREFU,’ while 1News wrote about how the PREFU provided a ‘better picture for the Government’s books.’
A set of accounts that include a profit and loss account, a cash flow account and a balance sheet are designed to be considered in the round. A two-dimensional snapshot of one line at the bottom of one of the accounts can appear to prove something, but a closer look at all the lines of all three sets of accounts provides a more three-dimensional and nuanced view.
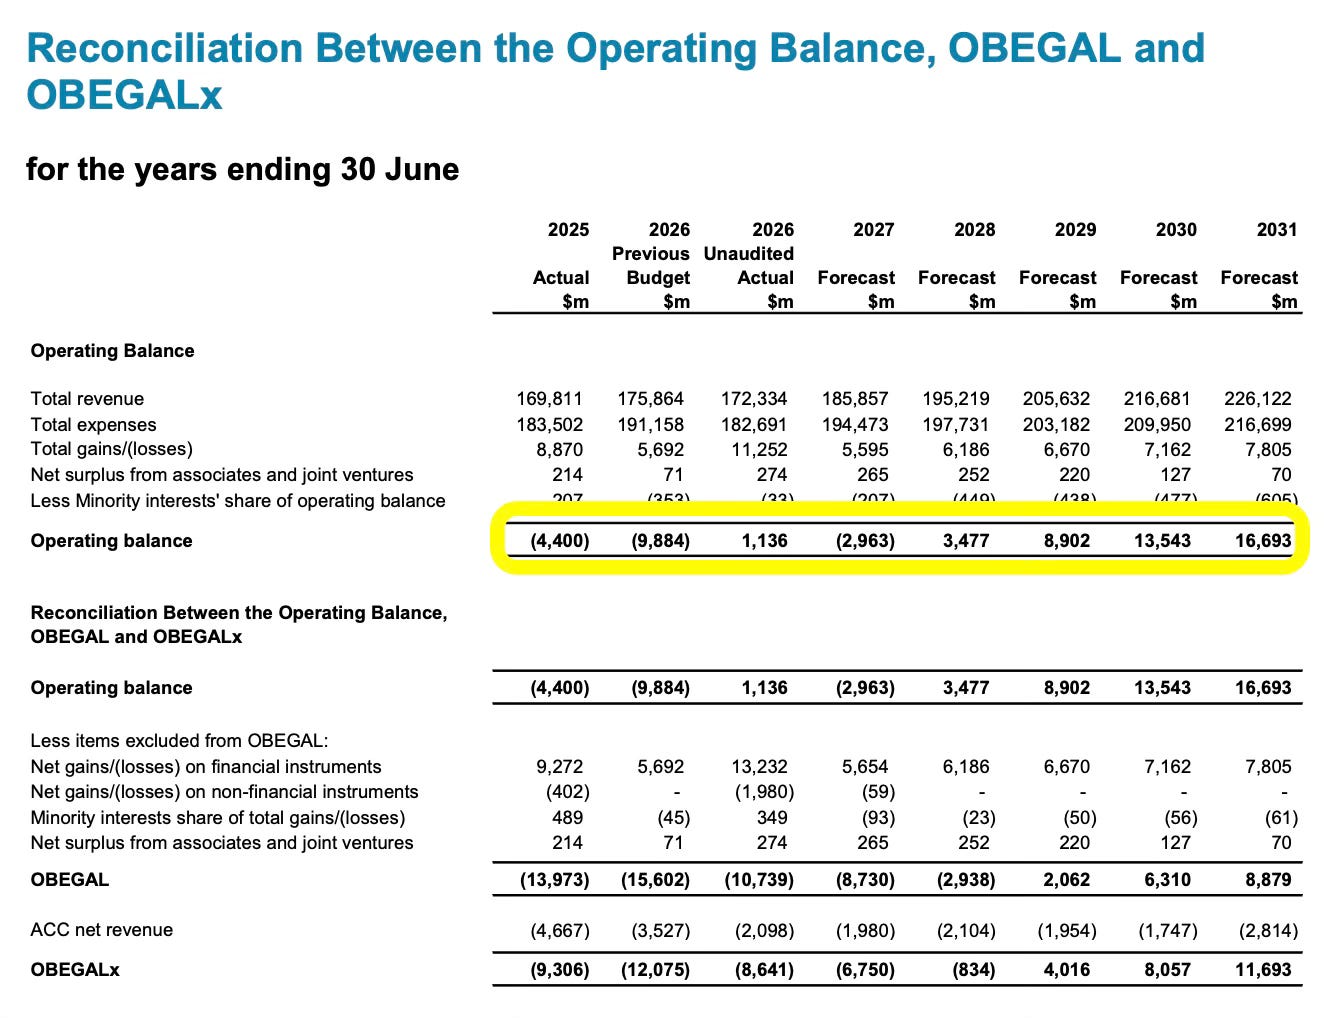
For example, here’s the ‘P&L’ part of the accounts in the PREFU, which refers to the Operating Balance and other versions of it called the OBEGAL (Operating Balance Excluding Gains and Losses) and the OBEGALx, which excludes losses from ACC. The current Government says the OBEGALx is the best measure. Labour says the OBEGAL is the one. The pure ‘Operating Balance’ used to be the standard.
The PREFU shows it actually was already in a surplus of $1.136 billion in the just completed 2025/26 financial year, much better than the $9.884 billion deficit forecast in May. The Operating Balance is then forecast to rise to a surplus of $16.7 billion by 2030/31. The Government’s preferred measure, the OBEGALx, is forecast to be in a surplus of $4.0 billion by 2028/29, an improvement from the $2.6 billion forecast for 2028/29 in the May Budget.
So why did the ‘bottom line’ ‘improve’ since May?
The implication of the ‘better’ (bigger) surplus is the Government ‘managed the books’ better and produced a higher ‘profit.’ But, as Treasury pointed out, the improvement was largely due to the side-effect of what most consider a bad thing: inflation. Higher inflation increased nominal incomes and spending, which in turn lifted some taxpayers into higher tax brackets and flowed through into higher GST and corporate tax receipts. This is what’s called ‘Fiscal Drag’ and it’s something Willis has already referred to as a bad thing that could be reversed to provide some ‘tax relief.’
Profit is, in theory, a better measure of success than a simple look at the net cashflow reports and forecasts. They showed the net core Crown operating cash flow is expected to be in surplus next financial year (2026/27) and hit a surplus of $13.3 billion by 2030/31.
But that can be misleading too, because it doesn’t take into account whether the Government is spending on repairs and maintenance in a way that at least matches depreciation, in order to keep the Crown’s assets in good shape.
There are a couple of measures of capital expenditure or investment in the accounts.
Page 118 lays out the forecast spending, including the unspecified and unconfirmed stuff. It shows significant falls in confirmed investment in Health, Housing and Transport.
This is reflected in this chart showing a fall in actual investment from over $15 billion in 2023/2024 at the tail end of the Labour Government to around $12 billion in 2025/26. It is forecast to keep falling from this current year, especially once the unspecified ‘capital allowances and unallocated contingencies’ are identified. They could happen. They might not. The last three years shows they didn't.
This consolidated measure is particularly useful. It shows capital expenditure forecast to fall from $4.6 billion this year to $2.7 billion by 2030/31.
Then there is the balance sheet showing snapshots for forecast assets, liabilities and net worth in the coming years.
Debt is the headline. But what about assets and net worth?
The Government is totally focused on running surpluses (profits) and reducing net debt, but doesn’t talk much about the Government’s assets and net worth. They show a more rounded and much healthier position than the Government likes to paint.
The Crown’s net worth is forecast to be stable at around 40% of GDP in the next couple of years, before beginning to rise again slowly.
So a more rounded picture of the PREFU is that the Government is choosing to keep sinking lids on spending growth in health, education, transport and housing, in order to keep pressing down on the size of Government to under 30% of GDP. It can expect cash and operating surpluses by the end of the decade by allowing fiscal drag to pull in the taxes, and for limited capital expenditure to keep the borrowing down.
And the (unmeasured) health, work, justice & housing liabilities?
Yet a fully rounded picture would include some sort of measure of the true liabilities of not investing in public health services, social housing and the health and wellbeing of our poorest, youngest and most vulnerable.
The accounts don’t measure the effects of poor health on productivity. Or the lost productivity of not investing infrastructure. Or the likely extra cost of yet-bigger prisons and hospitals to house those cast aside when young and being raised by homeless, stressed, cash-poor families. By the end of the forecast period, the Government expects to invest $700 million on Defence and Corrections, but $6 million on social housing investment.
The headlines might say the books look good.
But the pictures and scenes at ground zero of our political economy tell a different story. I walked back from the Treasury lockup this morning along Lambton Quay. There were homeless people asleep in front of some of the shop windows of the capital’s ‘Golden Mile.’ There was not a single crane to be seen building a new high-rise anywhere in the CBD.
One measure of Crown investment
Here’s one measure of how the Government’s management of the Crown accounts has filtered down to the real economy in Wellington in recent years. The index shows the Crane Index in Wellington less than a third its 2021 peak. Auckland’s Crane Index is about half its early 2022 peak.
Here’s the tables comparing recent crane activity in Auckland and Wellington. The actual crane counts tell the relative stories. There are 58 operating in Auckland and six in Wellington, including none in residential, aged care, data centres, health, civil or education. Two of Wellington’s cranes are upgrading its ferry terminal (albeit delayed) for (delayed) new ferries. One was repairing the Moa Point facility. And another was building a new building in the Parliament complex.
The Government has a strong balance sheet, low net interest/dividend costs and clear shortages in health care, housing and education. Yet it is choosing not to invest and employ because it has an ideological view that Governments should always be trying to be smaller than 30% of GDP (for National), or 33% for Labour.
Cheers
Bernard