Reminders
- Disclosure is in the email footer
- You can copy trade our potfolios here
- You can get our daily news updates here
- You can see our stock research reports here
- Not all of these stocks make it into our portfolios
** ALL OF MY PORTFOLIOS THAT I HELD IN 2025 ARE AVAILABLE TO BE SEEN AT THE BOTTOM OF THIS ARTICLE! This includes all current holdings and returns!
** YOU CAN ALSO SEE MY WEEKLY PICKS FOR DEC 30 - JAN 2
**Please enjoy this whole article for free thanks to CONSTANT CONTACT!
Good Morning, Simple Side Shareholders
Last week we took a quick look at some of the macro indicators that I have been building and working on in the background. We are going to start implementing these strategies into our investing in 2026 and wanted to give you all another look into systems we have built.
We are tracking 3 main things:
SPY — EquitiesTLT — BondsGLD — Gold
I wanted to build a system that would utilize tickers so that anyone could implement this strategy if they so wished. That meant easily tradeable tickers (no options, no futures, etc.)
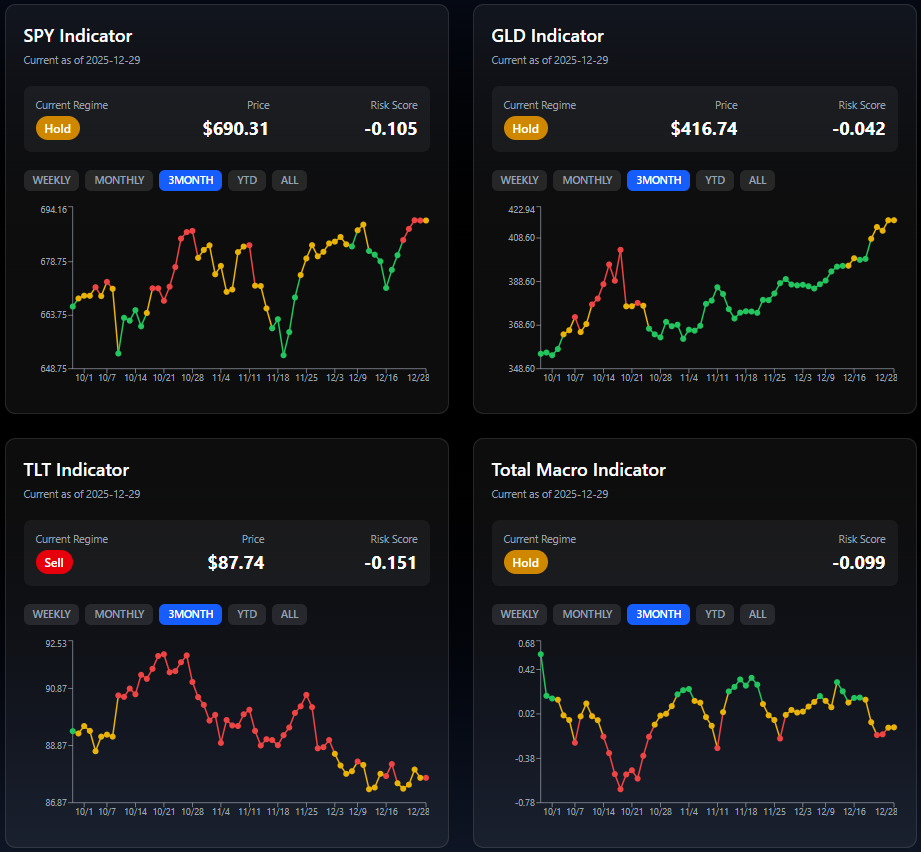
With that being said, let’s jump into the current regimes we are seeing across all three markets (Equities, Bonds, and Gold). As a reminder, I have built these charts on thesimpleside.news/market-indicator so you can go and play with them there!
Eventually, these will end up behind a paywall, so if you would like to get access, I would join our paid plan ASAP!You can do so by clicking here!
Now we are going to jump into the three different regimes driving GLD, TLT, and SPY (gold, bonds, and equities). Before we do so, I want to let you know that at the end of these three sections, I will be setting up an “Optimal Portfolio” to follow based on my macro assessment. My goal was to find something to do with my 50% cash position that could potentially yield returns higher than 3.25%/yr outside of HYSA (high yield savings accounts). I will start with a small total cash position of around $1k as a test and then build the portfolio up as time goes on and there are true outsized returns from the portfolio.
This portfolio will be something I hope to start tracking in 2026, and will continue to build and track over the next year. After I discuss the three current regimes each week, I will share the overall portfolio positioning.
Using this strategy over the past month, I yielded the following returns
As you can see I made about 2% over the last 21 trading days while the SPY lagged growing by less than 1%.
Equities (SPY)
I want to start out with our macro view over the past year. You can click on this image to expand it.
The overall regime for 2025 in equities has been “risk on” meaning equities were a buy in 2025. Now, as you all know I have been heavily in cash in 2025 (50%). Now, if I had this indicator built then, would I have been as risk off? Probably not, but I didn’t have this built. Sadly, this mean we have left some $$ on the table this year. It is frustrating, but in general I like being in the current cash position that we are in.
The question is, why? Well, in general I don’t like the forces that are driving the market. You can see on the graph where I have drawn some large red lines which mark emotionally driven sells that have happened in the market.
Now, the indicator has caught them and labeled them as “Strong Buys” in the short term, but how long will it be before we see one of these dips that doesn’t stop? The sad reality is that I do not know, and neither does anyone else. One thing I do know is that risk of that happening increases drastically when the markets are driven nearly entirely by emotions. So yes, this is a risk off environment for me.
If you want a quick look at the SPY regime for the past month, see the following graphic. Again, this is viewable at thesimpleside.news/market-indicator.
So, coming into the first week of 2026 we are showing a “risk-off” regime.
Bonds (TLT)
The first thing I want to show you with bonds in the price relative to the historical price we have seen since 2024. Please note that the line you are looking at is colored by the regime we were in at that time.
You can see that bond prices are sitting at the same levels now as they were at in 2004. Note that this doesn’t directly mean that bonds are cheap. Bonds aren’t like a company that builds up its revenues overtime — they pay a rate (set by the Gov. in this case), and are priced according to the rate they pay. There are other factors as well, but in general this is how they are priced.
In general, bonds have been jumping between risk on and risk off this year.
Over the past month though, we have been in “strong sell” territory and this past week we came into some “hold” territory. In general, I would say a “strong sell” or “strong buy” would mean it is time to enter or exit for short term gains. Currently we sit in that “hold” territory, and I would imagine we will sit here through this week.
I will say that the past few months of risk off sentiment does bode well for equities (aka the SPY). The next inflation report will come out about 2 weeks into January, and the future price of bonds will probably be pretty dependent on what we see out of this data. One thing that I am not expecting is “higher for longer” CPI marks. Obviously, due to the gov. shutdown we missed a reading in October, but in general inflation is trending down and I expect it to do so in January as well.
Obviously this data will not be 100% accurate, and adjustments can happen, but in general I expect things to sit and remain around that 2% to 2.5% mark. This will general bode well for bond prices.
Commodities (GLD)
I had to come back and adjust what I had written here after what the market did to gold and silver today (SLV down 7% and GLD down 4.4%). In general, this doesn’t come as a surprise as the indicator switched from “buy” to “hold” showing a changing in tides for gold. Will the drop be sustained? That is another question that I do not have the answer to. I would assume that our indicator will soon pick up some red or green in the graph soon and we will know that it is time to enter or start exiting into GLD positions.
I don’t have a play on gold here because there is no strong conviction one way or another from the indicator.
The Current Macro-Driven Portfolio
The current portfolio is as follows:
SPY18.38%
GLD71.48%
TLT10.14%
Weekly Roundup
Outlier Events
The WBD takeover battle escalated as Paramount Skydance added a $40.4B personal guarantee from Larry Ellison, while WBD’s board continued to favor Netflix’s alternative.
Gold and silver printed new records, and the S&P 500 and Dow closed at fresh highs in a holiday-shortened week.
Notable deals and headlines included ServiceNow buying Armis ($7.75B), Alphabet acquiring Intersect ($4.75B plus debt), Waymo’s temporary pause during a San Francisco blackout, and a rare insider buy pop at Nike after Tim Cook’s purchase.
What Happened Last Week
Equities drifted higher on light volume, led by AI stocks and broadening participation beyond mega-caps.
The 10-year hovered near 4.1% as mortgage rates eased into the low-6% range, supporting housing activity at the margin. Macro prints were mixed: a firm 4.3% Q3 GDP contrasted with a dip in consumer confidence, while holiday spending tracked relatively solid. Bitcoin was range-bound in the high-$80Ks to low-$90Ks and precious metals outperformed.
Our Opinions This Week
The market remains a rates-and-AI story into year-end.
Near term, we are watching whether the gold/silver momentum persists if rate-cut odds wobble. Base case: constructive into the final prints of the year; stay tilted to cash-strong positions and portfolio leaders.
Remember, we are investing in a very volatile and emotional market right now. It is NOT the time to be placing super speculative bets unless your risk tolerance is above the moon. In general, I think heavy cash wins over the next few months/weeks until the market decides to get a better footing.
Stock Research Reports
As you all know, one of the things we offer subscribers are research reports on stocks that we think have potential to outperform over the next year-ish. We publish all of these stock picks in the same place our market indicators live: thesimpleside.news/stock-research.
Currently, we are seeing outsized returns and a shorter timespan than we would have expected.
Here is one of our recent picks that already hit its target in less than 2 months…
We made a call on AppLovin (APP). We called for a 38% return on November 18… and we expected it would take us till Q2 2026 to reach that target, but APP surprised us. We surpassed the $730 price target on Monday, December 22, and secured the gain!
Here is the article we wrote back on Nov 18:
Now, these research articles we send out for free, but we have other things we offer only to paid subscribers. Our real personal portfolios are one of those things. We have our own money invested in them, and if you want to learn about them, today is your lucky day…. so keep reading…
Portfolio Information
Paid subscribers get direct access to all of these portfolios & real-time updates by joining paid here. Or you can directly copy trade by going here: Autopilot.
Typically, these portfolios are hidden behind a paywall. You can’t see them, you can’t access them, and you can’t find them anywhere online. That is, of course, unless you join our paid membership!
HOWEVER, today you get a one-time access to everything FOR FREE. I do this every December to let people know that I am being 100% honest about my portfolios, to show that I don’t just have things tracked in a spreadsheet, and so that you all can see that what we do here isn’t just to sell you on my newsletter. It is to build real wealth investing together.
I make more money from my investing than I do from the newsletter. That is why you don’t see me trying very hard to “sell” my newsletter to you. That is why I give away money every year, but there is one more reason…
I value openness and honesty in the finance community. It is something that a majority of people in the space lack. All of their returns only exist in spreadsheets; they promise courses that “teach you how to invest,” and for some reason, you can never seem to match their same returns… isn’t that strange?
All of my returns exist in a spreadsheet too, well they used to.
Now all of my portfolios are live on Autopilot. So you can see REAL RETURNS, in REAL TIME.
Portfolio Returns, Holdings & Updates
Our Flagship Fund is the one you saw the returns for earlier. We have managed to achieve over 500% returns since 2020 with only 1 major drawdown year of >30%.
Now, anyone who tells you that they are a great investor because they performed well since 2020 and doesn’t acknowledge that we were and are in the greatest bull market of all time is experiencing the “Dunning-Kruger effect.” Also known as someone who is too stupid to know that they are stupid.
Of course, I and every other investor on the planet did great from 2020 through 2025. There was no other option… The market forced individual stock investors to outperform. Needless to say, we have been very blessed over the past 5 years, and I do not expect the same performance to continue through 2026, nor do I expect to see it over the next 5 years.
The AI Second Hand Effects portfolio was a high conviction group of stocks that we wrote about in late 2024. The idea was simple: everyone was chasing gold, so why not start selling them their shovels? In this case, the gold was AI, and the shovels were land, data centers, and energy.
The strategy and the portfolio have done extremely well. Since November 2024, the portfolio has returned a staggering 52% and is up 17% since July 2025. This portfolio’s goal is to do one thing and one thing only: find the second-order effect before everyone else. So far, we have been able to do that, and we hope to continue this trend into 2026. Since the main “boom” has really run its course, we are focusing on companies with cash flow and real ability to turn energy, data, etc., into cash.
Regardless, energy demands aren’t stopping anytime soon, and we hope to watch this portfolio’s value do the same.
Finally, we get to the Tech-Focused growth portfolio. This portfolio is a bit more complicated in nature, but in general is much better suited for those looking for long-term bets with higher risk/reward ratios. In this portoflio we are focused more on large and mid cap growing companies primarily in the tech space. Although, as you can see many different sectors are represented: healthcare, payments, insurance, cloud & cyber, etc.
In general, we look for undervalued companies that are growing consistently & quickly, and seem to have a stronghold on their respective industry. HOOD and HROW are great examples of large cap companies that fit the mold. Both are massive players in their respective industries.
HOOD is a huge player in the financial services space and has a niche with the retail investor. The company has a nicer UI/UX than competitors, and is one of the few companies willing to innovate quickly. Their revenue is on a 3-year 51% CAGR run and shows no signs of slowing. (So we have growth, a moat on the industry with retail and UI/UX, and at the time we bought it, it was undervalued based on growth assumptions).
HROW, on the other hand, is a player in the pharma space focusing on ophthalmic therapy. It sounds super fancy, but in reality, it is just therapy that uses non-surgical procedures (like games, filters, etc.) to help train the eyes and brain to work together. It corrects issues such as lazy eye, eye misalignment, and general coordination problems. When I read this, I see “AFFORDABILITY” screaming at me, and in a world driven by high prices and low wages, affordability reigns supreme. We also have revenue growth of 35% CAGR over the past 3 years, and a company that is projected to grow 40% over the next year. Again, this covers all of the bases.
In general, the companies in this portfolio are meant to be held for extended periods until “the crowd” catches on to what is happening and the stock “blows up.” This is when you start seeing the name in the news, or your dad starts talking about it — then it is time to sell.
Weekly Picks Performance
**We treat the trades as buys on Monday’s Market open and sells on Friday’s Market close. We also have a -1% stop loss on each stock. The max gain isn't set to be a "sell as soon as we reach it" number. Typically, we watch the stock for around 10-15 mins when it passes the "max gain level." Then if the stock has surpassed the max gain we set a stop loss at the max gain level.
This allows us to "let the winners ride" while maintaining upside and capping potential losers.**
We have generated excess returns of 77% on these weekly picks alone.
Weekly Picks
🟢 The Buys:
MPWR — Monolithic Power Systems
* Expected Weekly Return: +0.50%
* Context: 1-month trend +1.28% ≈ 0.32% per week
* Key Drivers: Early MACD turn, improving 3–1M momentum (+4.69%), long-term strength intact despite being below the 200-DMA. High-quality semi name in early recovery phase.
GOOGL — Alphabet
* Expected Weekly Return: +0.55%
* Context: 1-month trend +2.33% ≈ 0.58% per week
* Key Drivers: Strong multi-timeframe momentum (3–1M +31%, 6–1M +79%), RSI in trend-healthy range, dominant cash-flow profile with AI optionality.
APH — Amphenol
* Expected Weekly Return: +0.55%
* Context: 1-month trend +1.48% ≈ 0.37% per week
* Key Drivers: Accelerating momentum (12-month +99%), MACD positive, leadership behavior within hardware despite longer-term DMA gap.
LRCX — Lam Research
* Expected Weekly Return: +0.80%
* Context: 1-month trend +5.25% ≈ 1.31% per week
* Key Drivers: One of the strongest momentum profiles in the entire universe (12-month +112%), RSI firmly bullish, leveraged to memory capex recovery. Higher beta, higher payoff.
IDXX — IDEXX Laboratories
* Expected Weekly Return: +0.55%
* Context: 1-month trend +1.34% ≈ 0.34% per week
* Key Drivers: Defensive growth compounder, rebuilding base after correction, strong profitability and consistency versus the cyclicals.
KLAC — KLA Corp
* Expected Weekly Return: +0.65%
* Context: 1-month trend +2.70% ≈ 0.68% per week
* Key Drivers: Best-in-class margins, steady momentum (12-month +82%), lower volatility relative to other semis with still-meaningful upside.
- ¢, Founder of The Simple Side
No Investment Advice or Brokerage; Disclaimer. For the avoidance of doubt, The Simple Side does not provide investment, tax, or legal advice. As with any asset, the value of any asset class can go up or down and there can be a substantial risk that you lose money buying, selling, holding, or investing in any asset. You should carefully consider whether trading or holding assets is suitable for you in light of your financial condition.