This is a free preview of a paid episode. To hear more, visit thesimpleside.substack.com
Enjoy this article thanks to Wild Alaskan Company!
Reminders: Copy Trading HerePortfolio Views HereMacro Indicators HereResearch Reports Here
Good Morning, Simple Side Shareholders…
I am going to write a lot (sort of ramble) about the current state of our portfolios, but there is a summary at the bottom of this section that will hit the quick highlights.
Let’s address the elephant in the room… an absolutely brutal week for our portfolios. Across the board we got crushed and it was absolutely no fun to watch it happen. That being said, the outlook for these portfolios is not 1 week, or 1 month, or 6 months… I try to invest for at least 1 year and many of the holdings in my portfolio have a 3 year (or more) time horizon.
In general, I am not super worried about the recent market drop. I don’t think that AI is going to suddenly render companies useless. Yes, you can build your own apps, and yes you can build your own software, but then you have to host it, manage it, fix all of the bugs, and your only tech support is another AI. The questions I started to ask myself were simple truths about the business we own…
Do you think that companies are going to create their own custom tax software instead of using Intuit? Do you think that companies are going to create their own custom PDF software instead of using Adobe? Do you think that companies are going to create their own custom security and compliance software like Qualys?
I just don’t see that being the case, and if you think AI companies are going to take away from the moats that these companies have then I would disagree. I think it is much easier to integrate an AI solution into an already working product than it is to build a completely native AI product. Google is a great case study. Remember when everyone was hating on Google because the company wasn’t far enough ahead in the AI race? It took them a few months to catch up and surpass nearly all of their competitors. I think more of the same will apply to the companies we own.
That being said, I refuse to believe that I will read the market 100% right 100% of the time. There was probably a world where I could have predicted that software companies would go under fire because of AI fears, and I would have stopped my investments in some of my Flagship Funds biggest losers.
I am sure that I had opportunities to decrease my tech exposure in the Tech-Focused Growth portfolio when AI worries came about as well. Luckily, the AI portfolio is focused on infrastructure which tends to outperform in market downturns. Of course, we have a lot of speculative holdings so we will never be completely absolved of market downturns, but we will fare much better.
Well, now that we have addressed the underperformance of our portfolios, let’s talk about what I am thinking about and how I plan to make changes in my investment strategy as we continue through 2026.
While I watched the market and my portfolios tumble this week, the first thing that came to my mind was “Thanks be to God that I have a 50% cash position” the second thing that came to my mind was diversification.
My overall holdings are heavily indexed into tech, and specifically software, and I felt the pain because of it this week. My Flagship Fund is typically focused on high growth, low cap-ex companies regardless of the sector they are in.
In the past, this has resulted in portfolios with 3/20 stocks in the software sector, it has resulted in 4/20, and of course this year we ended up with our highest concentration ever with 9/20 (darn it). This isn’t the worst thing in the world, but our worst returners are -32%, -23% and -23% (all of which are software companies). Honestly, I think allowing a very volatile sector to take over a vast majority of the portfolio was an oversight on my part. That being said I firmly believe that these companies are extremely quality and do not (in any way) deserve the selloff they received.
Regardless, all of the issues in the market have brought me to 3 distinct paths:
* Stay the course, potentially index heavier into some of my higher conviction holdings. Look to DCA into some positions that are underwater that I like.
* Shift portfolio weights in some of our funds to reflect a lower tech/software focus, and make no additional purchases.
* Shift portfolios by adding new positions and diluting current underperformers.
What is so challenging about the current market is that you could be 100% correct about a stock, its ability to grow, and the fundamentals and the stock price will struggle while “performative” names are quicker to explode in price regardless of performance.
QLYS for example saw 10% growth in 2025, had EBITDA of 47%, released an agentic AI risk management marketplace, and announced more share buybacks. The company projected growth of 7% in 2026, remains incredibly profitable, and has better growth rates than the majority of the industry.
The stock after earnings? Down 14%… how does that make sense? The company is now valued at the same level that it was back in 2021 when their revenue was basically HALF of what it is today. If the company was showing terrible metrics and was not growing, I could understand the price action but with growth, buybacks, and great profits I couldn’t be more lost.
I have been saying it for weeks, but the emotional driven marketplace is what we exist in right now.
The internal debate is whether or not we should diversify to dodge some of the emotional risk involved in individual sectors, or trust that the companies we own are high quality and will recover.
Something else that is very important to think about is the multiples that companies trade at. When you look at a company’s PE ratio, you know that is a “value indicator,” but what does it really mean.
Well, simply put, it is the amount of dollars you are willing to pay for $1 of that companies earnings. So if a company earns $100 and you buy their stock for $200 you are paying $200 / $100 = $2 dollars for each dollar of earnings. This also tells us that at that same price point, it would take 2 years of that company operating at the same level for its earnings to be worth what you paid for it. In this example if you pay $200 for a company and then in year 1 it makes $100 and then in year 2 it makes another $100, then you paid a fair price. However, if the company in year 1 makes $100, then in year 2 makes $90, you overpaid by $10 for that stock.
Now things aren’t always that simple because stock prices don’t follow their earnings 1:1, and people speculate. I doubt that many people are willing to hold a stock they bought at a 22 PE for 22 years.
Why am I explaining this right now? Well, because in this case it matters greatly. People are willing to pay high PE multiples when they see companies growing, or when they think their is a clear opportunity for the company to maintain their current earning levels.
What we are witnessing with software is a loss of faith in companies earnings growing, and the question you have to ask now as an investor is when does this faith come back? Stock prices move on investor emotions not the true underlying fundamentals. These software companies are going to have to “prove” that their earnings won’t be hindered by AI, but will continue to grow.
Sadly, this will take at least 1 or 2 quarters of proven growth before I think we start to see real turnarounds in these companies. I say “sadly” because I am selfish and I want every stock I buy to launch to the moon immediately.
Overview
* Our portfolios are over indexed on the software sector (that isn’t normal, but just so happened to be our bad luck this year) which means we got hit HARD this past week.
* We are looking at positioning our portfolio differently going into the next few quarters in case investor sentiment around the software companies remains low.
* Stock prices are based on investor emotion in the short term, not real fundamentals so PE ratios and FCF multiple could decrease further from here.
* I think we have a path to recovery over the next 1-2 quarters as long as we see earnings continue to grow.
* I have an interim plan of attack for the next 2 quarters while we wait to see if we need to trim our software positions.
Of course, all of my strategies and and investment decisions will be hidden behind the paywall, but before we get into that I want to quickly share the current quant analysis we have on the macro environment. Like always, the macro analysis can be found on our website: (https://thesimpleside.news/macro-indicators).
Let’s start with our general macro overview…
General Macro Overview (Quant Model)
In general, our quant macro model isn’t bearish here. We are still riding between buy and hold territory which really isn’t good enough for us to say “back up the truck” nor is it bad enough for us to say “unload everything.” We are waiting to deploy large amounts of capital until we see the “Strong Buy” show up across the board (in the Macro, SPY, and GLD models).
You’ll notice that the model is still ranking GLD a strong buy at these levels which, in general, I think is a bit of a bearish call on the current equities markets. Regardless, I think the economy and the underlying forces driving profits for these companies are stable.
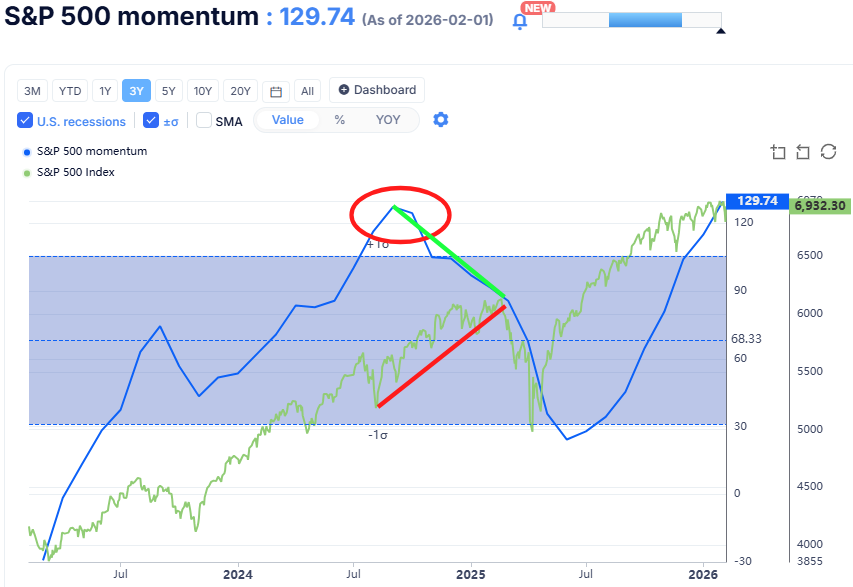
One of the market indicators I pay attention to closely outside of my personal macro model is this S&P 500 momentum model. The nerd explanation for this model is the “slope of the 12-month regression of the S&P 500.” The simple way to think about it is the pressure on investors and the market. The higher the indicator goes, the more pressure there is to buy (higher emotionally driven market). The lower the indicator goes, the more selling pressure there is (also higher emotions in the marker), and the closer the line is to it’s average, the more fundamentally driven the market is.
Now, I don’t think we should be using the S&P 500 momentum model to buy or sell the markets, but I do think it gives us a great picture of market anomalies that do provide good opportunities in the market.
You can see pictured above and example of one of these anomalies. The market is rising as the general momentum in the S&P 500 is falling, then all of the sudden we see this HUGE drop in the S&P 500. This won’t happen every time, but falling momentum for multiple months in a row like that is never a good sign.
Remember, a stock price is only worth as much as the next guy is willing to pay and typically if there are 100 people selling and 1000 people buying the price is higher. If there is a loss of momentum (more sellers than buyers) then we will start to see the S&P 500 drop.
Another thing I am watching closely are insider buys which have been decreasing more and more over the past 3 and 5 year periods.
You can see the S&P 500 modeled in green with the black line show it’s current trend, and then we have the orange line showing the current trend of insider buys.
What we are seeing is a decreasing amount of insider purchases, a macro regime that is relatively undecided, and the momentum of the S&P 500 hitting a level we haven’t seen since July 2025. It is a frustrating answer, but the reality is that we are in a period of “wait and see.” I honestly do not think that there is a clear path to making a decision in the short term. Now, give us the first two quarters of earnings calls and then I think it will start to become apparent.
I still remain 50% in cash. The market does not currently deserve to be valued as highly as it currently is, and the potential for a LARGE downswing is much more likely than another HUGE upswing.
The Macro Portfolio is still CRUSHING the SPY, it is currently up over 10% in 2026
Weekly Chartstorm
This week’s sector returns showed investors leaning away from the mega-cap tech and media names and toward areas tied to commodities, industry, and steady cash flow.
Basic Materials led at +3.16%, followed by Consumer Cyclical +2.76%, Industrials +2.05%, and Energy +2.04%. On the other side, the weakest groups were Communication Services -3.70%, Technology -2.87%, and Healthcare -2.29%. Even with several sectors up, the index struggled because the biggest declines were concentrated in some of the market’s largest, most heavily weighted companies.
What the sector data shows
When Technology and Communication Services fall in the same week, the index often has a hard time holding up because those sectors contain many of the largest stocks. That played out here. The “winners” list was broad, but the “losers” list was heavy.
Energy and Materials strength also fits what we usually see when investors want exposure to real-world demand and pricing power. Energy benefited from firm crude prices and strong moves in large integrated names, while Industrials strength lined up with improving manufacturing sentiment and company-specific wins in big industrial leaders.
What the largest stocks did
The week was shaped by sharp split performance inside the mega-caps:
* Down: Amazon -12.11%, Meta -7.68%, Microsoft -6.77%, Alphabet -4.48%, Tesla -4.48%, Nvidia -2.99%.
* Up: Apple +7.18%, Walmart +10.11%, JPMorgan +5.40%, Berkshire Hathaway +5.74%, Exxon +5.41%, Caterpillar +10.47%, Johnson & Johnson +5.61%, Eli Lilly +2.03%.
In plain terms: a handful of very large tech and internet names fell hard, and that outweighed the steady gains across much of the rest of the market.
What moved the market this week
A lot of the attention stayed on two questions: how fast the economy is growing, and what interest rates might look like next.
* Growth expectations: The Atlanta Fed GDPNow estimate was cited at 4.2% for Q4 2025, and there were public comments pointing to 5–6% growth in 2026. Those are optimistic numbers, and markets will treat them as “possible,” not “guaranteed.” If growth holds up, it can support corporate earnings. If the numbers cool, stocks that already assume strong growth tend to react first.
* Federal Reserve leadership: The expected change in Fed leadership added uncertainty around where interest rates go next. Some investors are reading the incoming chair as more willing to cut rates if productivity improves, while others are focused on the risk of political pressure on the Fed. The practical takeaway is simple: when the path for interest rates feels less clear, markets usually become more sensitive to economic data and big-company guidance.
* Valuation backdrop:
* Shiller CAPE: 40.09 — this is a long-term price-to-earnings measure using 10 years of inflation-adjusted earnings. A higher number means stocks are expensive relative to that long history.
* Buffett Indicator: 2.229 — a rough comparison of total market value to the size of the economy. Higher readings mean the market’s value is large relative to economic output.
* 10-year minus 1-year Treasury spread: 0.75% — longer-term yields are above shorter-term yields. That’s healthier than an inverted curve, but it does not remove risk by itself.
Outlier events
Amazon: Shares fell hard after earnings as management discussed roughly $200B of planned spending focused on AI and data centers. That kind of spending can be positive long-term if it builds durable advantages, but it can pressure near-term profits and cash flow — and the market reacted to the near-term math.
AMD: The stock dropped sharply after results as guidance became the focus. When a major chip company signals slower growth or weaker margins than investors expected, it often spills over into the broader semiconductor and AI complex for a few sessions.
Gold and silver: After a major drop and then a rebound, metals became a headline again as futures margin requirements were raised. Big, fast price moves in metals can tighten risk appetite across markets, especially when traders reduce exposure in multiple places at once.
Crypto drawdown and bounce: Bitcoin fell hard midweek and then rebounded into Friday. That mattered because the week’s weakest equity groups included many companies tied to high-growth narratives. When crypto is sliding, it often amplifies pressure on the most speculative corners of the stock market.
Devon and Coterra merger: An all-stock deal targeting large cost savings by 2027 is generally viewed as positive for scale and efficiency, but it also signals that management teams see value in consolidation at current prices.
Notable insider transactions
Insider activity leaned heavily toward selling in large blocks:
* StandardAero: Major holders reported very large sales, including roughly $1.50B at around $31 and another $332M sale around $30.
* Diamondback Energy: A large holder reported selling roughly $332M.
* Banc of California: A large holder reported selling roughly $237M.
* Nasdaq: The CEO reported selling roughly $29M.
* Hartford Insurance: The CEO reported selling roughly $28M.
* WR Berkley: A large holder reported buying roughly $33M, plus an additional buy around $21M.
One week of insider selling doesn’t “call the market,” but clustered, high-dollar selling is still worth noting — especially in a week where the biggest growth-heavy sectors were already under pressure.
Analyst rating changes
Analyst actions skewed toward upgrades, with several high-profile names getting more constructive calls:
McDonald’s was upgraded to Buy with a $360 price target. Palantir saw multiple upgrades, including moves to Buy/Outperform with targets in the $190–$205 range. Visa was upgraded to Outperform. Broadcom and Taiwan Semiconductor were upgraded to Strong Buy. Roku and Ares also received upgrades, and GE Vernova was raised to a more bullish rating.
Thanks for reading! This post is public so feel free to share it.
Stock Research Reports
I have been MIA when it comes to writing my research reports… at the beginning of the year I was finalizing the new website and building the new Flagship Fund portfolio (both of which took priority over my research reports).
Now that both of these are finished, I can shift my focus back to writing and building out new stock research reports!
Oh, and by the way, our research reports have been CRUSHING IT!
If you are a paying subscriber, you can head over to https://thesimpleside.news/researchto get access to all of our historical and current picks.
Currently, we have posted a total of 16 picks, and of those we have a total of 12 closed trades and 4 open positions. Of our closed trades we have 10 winners and 2 losers.
We have 4 open positions and of those we have 2 picks that are in the green, and 2 in the red.
I will begin posting new picks this week! The first one that I am coming out with is a very high risk reward play. I don’t talk about these kind of picks very often and this will be reserved for paying subscribers only.
Portfolio Information
We currently have over $1.5 million dollars copying our trades on Autopilot!
Paid subscribers get direct access to all of these portfolios & real-time updates. My portfolios are available for paid subscribers to access in three places:
Joining paid here: LINKCopy trading On Autopilot: LINKViewing them on my website: LINK
I need to update the historical trades that we made in the portfolios in these past weeks.
Now let’s get into all of my portfolios, returns, and details…