In today’s episode of **What’s going on with BRICS**: Diving into GDP and PPP – your fun beginner’s guide to understanding why BRICS economies pack such a punch!
If you’re new to the channel, hey, take a moment, subscribe to the channel, then hit the bell to be alerted about new episodes when they drop.
This is part of our **BRICS Explainer Series**, fun tutorials breaking down key economic terms with simple examples, real-world facts, and zero jargon overload – perfect for beginners curious about the multipolar world.
Coming to you today from [location to be filled by owner].
**Field-Briefing Style**
**Date** - December 20, 2025
**Subject** - Measuring Economic Strength: GDP and PPP – A Fun Beginner’s Adventure!
**Classification** - Public
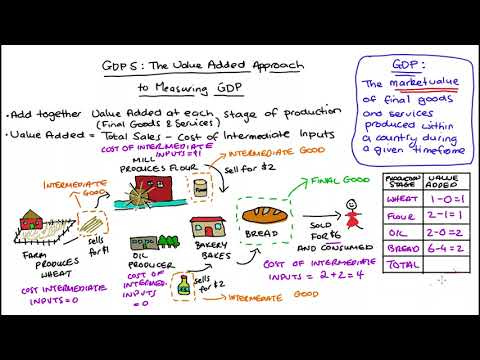
**What is GDP? (The Basics)**
1. Gross Domestic Product (GDP) is a country’s yearly scorecard.
2. It adds up the total value of all goods (cars, phones, coffee) and services (haircuts, apps, deliveries) produced in one year.
3. Simple example: In your town, a bakery sells $10,000 in donuts and a factory makes $100,000 in gadgets.
4. Add everything nationwide – that’s your country’s GDP!
**Nominal vs. Real GDP**
5. Nominal GDP counts everything at current market prices and exchange rates – like today’s dollar value.
6. Example: Brazil sells soy on the world market – the dollar price goes straight into nominal GDP.
7. Real GDP adjusts nominal for inflation to show true growth in actual stuff produced.
8. Example: If prices rise 3% but nominal grows 8%, real growth is 5% – more factories and jobs, not just higher price tags.
9. Fact: Real GDP helps us see genuine economic progress without the inflation trick.
**Why Costs Differ Across Countries**
10. A burger might cost $6 in the US but only the equivalent of $3 in India – lower wages, rents, and local prices.
11. This means the same dollar buys way more in some countries than others.
12. Without adjustment, comparing economies feels unfair – like racing on different tracks.
**Purchasing Power Parity (PPP) – The Fairness Fix**
13. PPP recalculates GDP based on what money actually buys locally.
14. It levels the playing field by using local cost of living.
15. Fun example: The famous Big Mac Index compares burger prices worldwide to show PPP differences.
16. Result: Countries where life is more affordable (like most BRICS nations) get a big boost in rankings.
17. Fact: PPP shows the real living standards and output power much better than nominal numbers.
**Who Measures and Reports GDP and PPP?**
18. National governments start it all – each country’s stats agency (like India’s NSO or China’s NBS) crunches their own GDP numbers first.
19. They report to international orgs for global comparisons.
20. For GDP: The IMF, World Bank, UN, and OECD compile and publish worldwide data, using national reports.
21. Example: The IMF’s World Economic Outlook database pulls in country data twice a year.
22. For PPP: The World Bank’s International Comparison Program (ICP) leads the charge, collecting price data from 200+ countries every few years.
23. The IMF and OECD use ICP data to create PPP-adjusted GDP figures.
24. Fact: The latest big ICP round was in 2021, with updates feeding into 2025 reports.
**Are These Sources Reliable? (Including IMF and World Bank)**
25. Overall, yes – IMF and World Bank data is widely trusted for accuracy, based on global standards like the IMF’s Data Quality Assessment Framework (DQAF).
26. They don’t make up the numbers; they verify and standardize national data.
27. But they’re US-based (headquartered in Washington, DC) and US-funded (US is the largest shareholder), so some critique potential bias in forecasts or policy advice.
28. Example: Critics say IMF growth predictions sometimes overestimate recoveries in Western allies or underestimate BRICS resilience.
29. Still, for raw GDP/PPP stats, they’re reliable – used by everyone from governments to investors.
30. Independent checks (like UN or OECD) often align closely.
31. Fun fact: Data quality varies by country; richer nations have better tracking, but orgs like IMF flag issues in reports.
**BRICS Alternatives and Reporting**
32. BRICS doesn’t have a full independent GDP/PPP authority yet – they mostly use IMF/World Bank data for their own reports.
33. The New Development Bank (NDB), BRICS’ own bank since 2015, focuses on funding projects, not publishing core economic stats like GDP/PPP.
34. Example: NDB reports on loans and infrastructure, but cites IMF for broader metrics.
35. BRICS leaders discuss stats cooperation at summits, and they’ve started joint reports (like the BRICS Joint Statistical Publication).
36. Fact: In 2025, BRICS statements highlight their 41% global PPP GDP share – but sourced from IMF data.
37. Outlook: Growing push for multipolar alternatives, but no NDB-led GDP reporting system yet.
**BRICS Timeline with GDP and PPP**
38. 2009: BRICS group forms – early talks mostly used nominal GDP, making the West look dominant.
39. Example: Like comparing salaries without adjusting for cost of living – BRICS seemed smaller than they really were.
40. 2010s: Experts shift focus to PPP for fair play.
41. Big milestone: China overtakes the US in PPP GDP around 2014-2016.
42. 2025 today: Expanded BRICS (with new members and partners) reaches about 41% of global GDP in PPP terms (IMF estimates).
43. Fact: That’s over two-fifths of the world’s real economic output – bigger than the G7 combined in buying power!
**Key 2025 Numbers**
44. Expanded BRICS PPP share: Around 41% of the world total.
45. China leads at roughly $35–39 trillion in PPP terms – powering EVs, high-speed rail, and massive cities.
46. India at about $15–17 trillion PPP – supporting manufacturing and services for 1.4 billion people.
47. Nominal global share for BRICS: Only 28–30% – proving why PPP tells the fuller, fairer story.
**What This Means for BRICS**
48. PPP highlights BRICS’ true economic muscle.
49. Helps secure better trade deals and funding through the New Development Bank.
50. Example: China and India trade in yuan and rupees, skipping dollar issues thanks to strong local buying power.
51. Drives de-dollarization and big Global South projects like Belt and Road Initiative.
**What This Means for the West**
52. Nominal GDP made the West look untouchable for decades.
53. PPP reveals BRICS closing the gap fast – forces rethink of influence in IMF and World Bank.
54. Example: More investment money flows to high-growth BRICS projects instead of traditional Western bonds.
**Possible Next Moves**
55. West may keep pushing nominal GDP rankings or build new alliances (like tech partnerships with India).
56. BRICS response: Expand local-currency trade (yuan-rupee, ruble-yuan swaps) and welcome more partners.
57. Mid-term outlook: More joint infrastructure locks in multipolar strength.
**Confirmed Video Sources**
58. Fun cartoon explainer: What is Gross Domestic Product (GDP)?
59. IMF clear basics: What is GDP?
60. Great PPP examples with Big Mac Index:
End of Briefing.
- In a multipolar world, GDP and PPP unlock the real story: BRICS isn’t just growing – it’s already a powerhouse reshaping global fairness and opportunity! 🌀