Abundance and YIMBY are on the march. Things are looking good. The wins are each small, but every little bit helps. There are lots of different little things you can do. In theory you have to worry about a homeostatic model where solving some problems causes locals to double down on other barriers, but this seems to not be what we see.
There are definitely important exceptions. Los Angeles is not so interested in rebuilding from the fires and backpaddled the moment developers started to actually build 100% affordable housing because somehow that was a bad thing. New York's democratic party nominated who they nominated. Massachusetts wants to seal eviction records.
Overall, though, it's hard not to be hopeful right now. Even when we see bad policies, they are couched increasingly in the rhetoric of good goals and policies. In the long term, that leads to wins.
[...]---
Outline:
(01:11) Rent Control
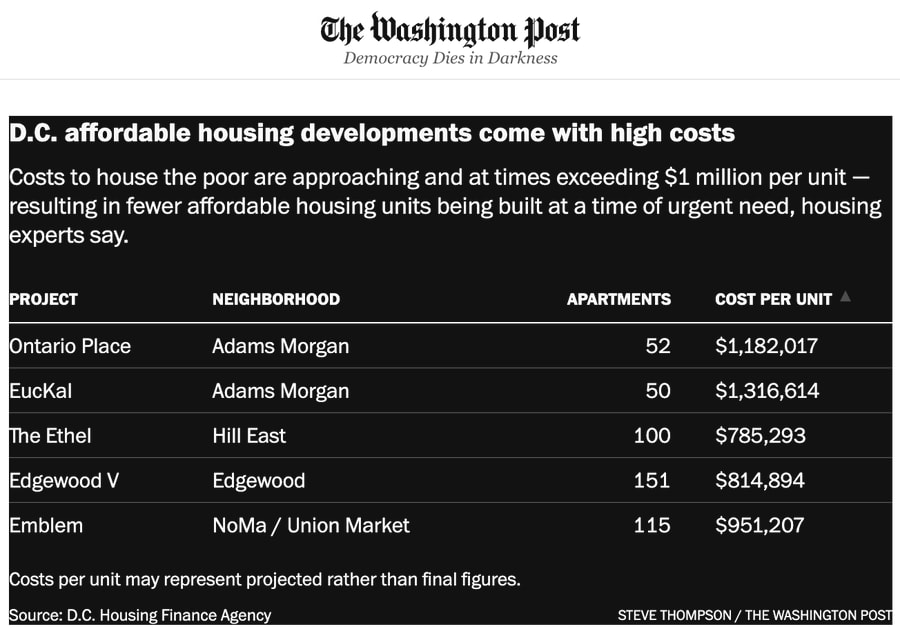
(02:52) Affordable Housing
(09:19) A Vision
(09:56) Private Equity
(11:14) Home for Rent
(14:08) Making Housing Worse On Purpose So You Can Click
(16:47) Open Philanthropy Strikes Again
(18:08) The Abundance Debate
(21:24) Single Staircase Apartment Buildings
(25:18) Dublin
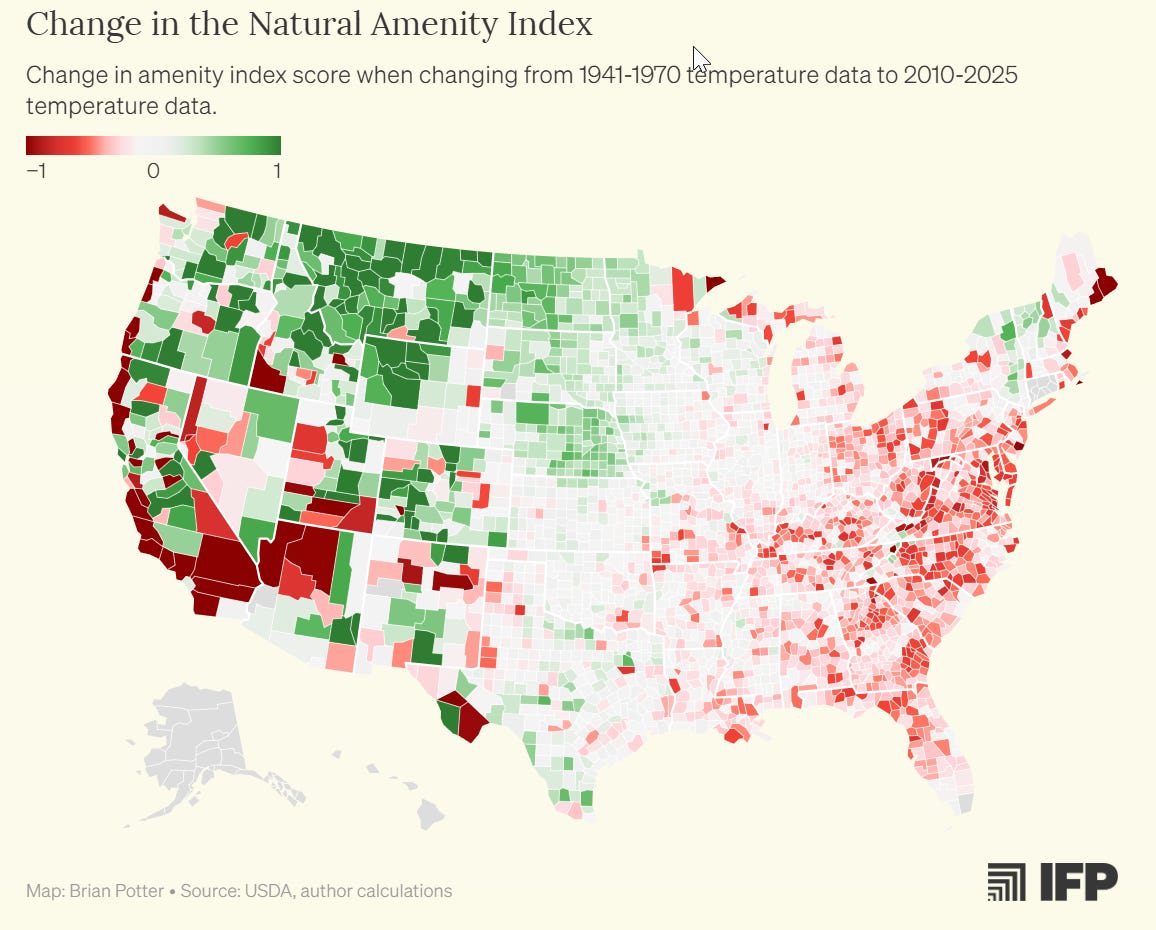
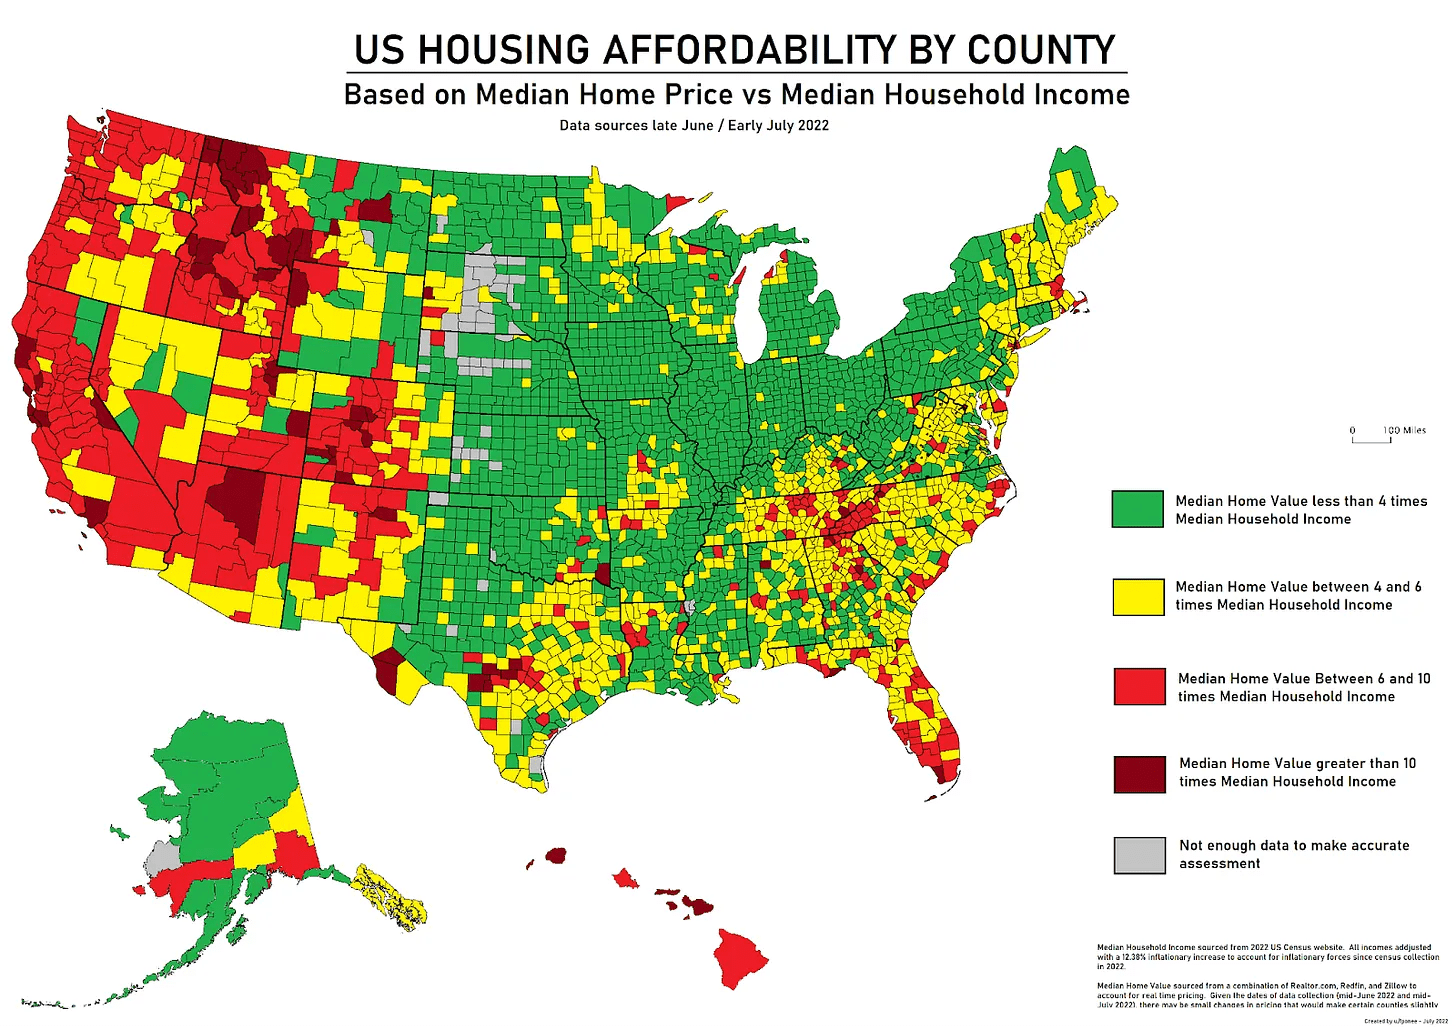
(25:43) Western Housing Costs
(27:22) Los Angeles
(28:16) LA Fire
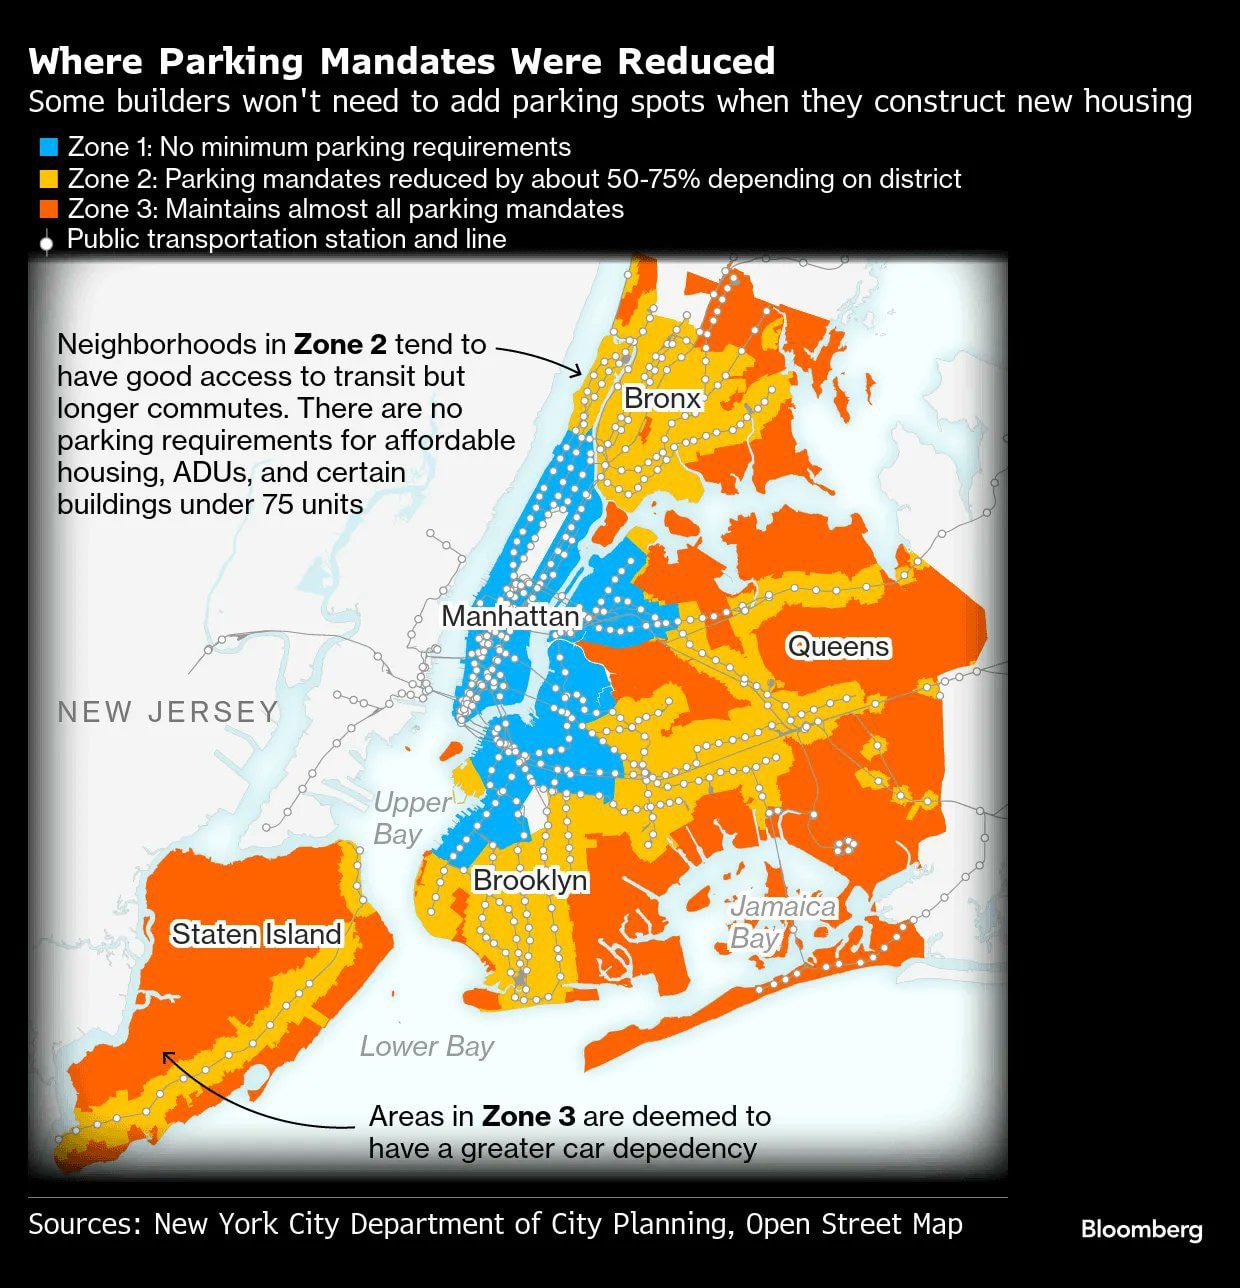
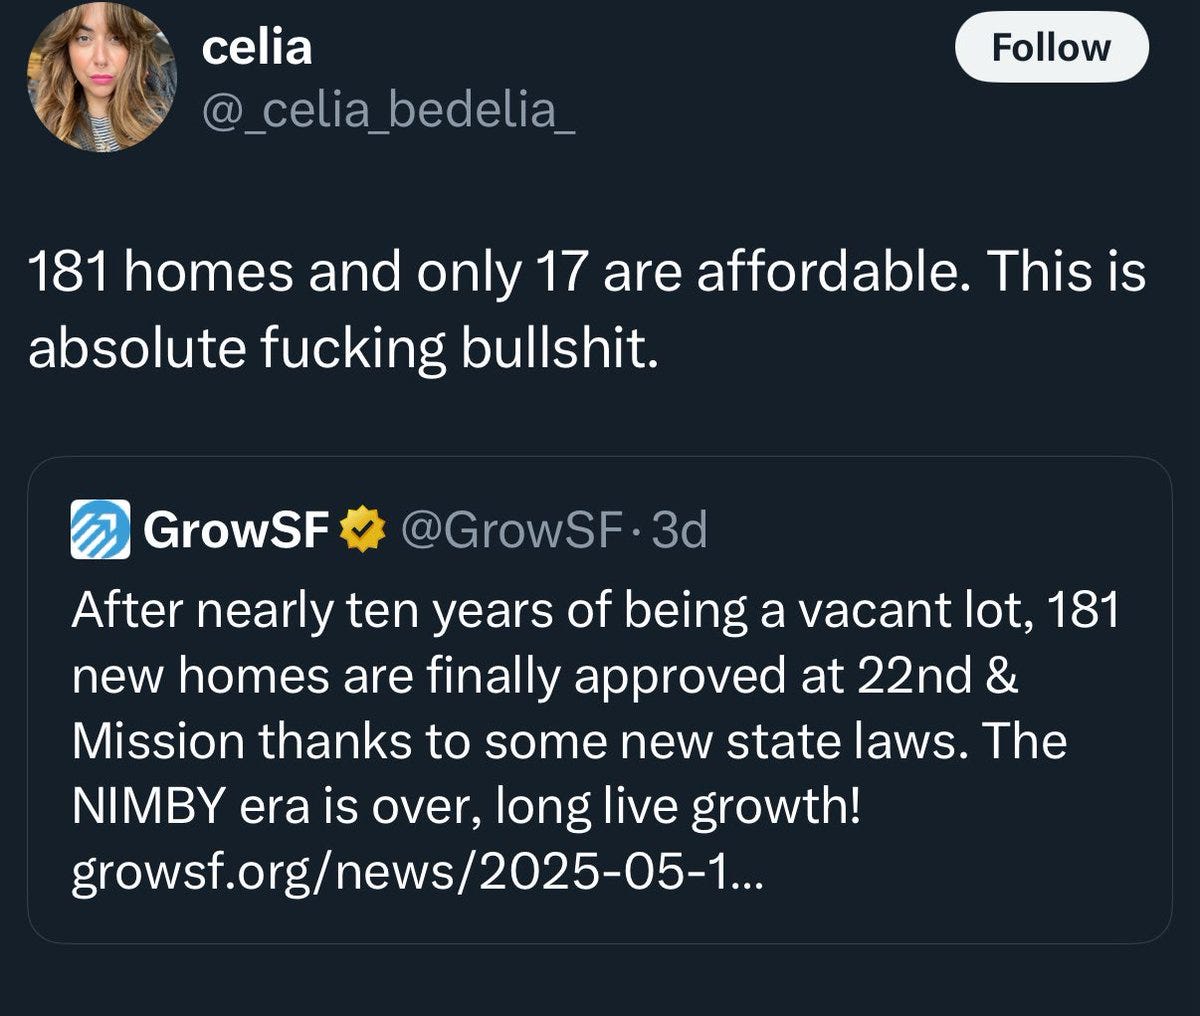
(31:15) San Francisco
(34:36) California
(39:27) Oregon
(41:34) Montana
(43:58) Maine
(44:50) North Carolina
(45:10) New York City
(49:10) Massachusetts
(51:43) Texas
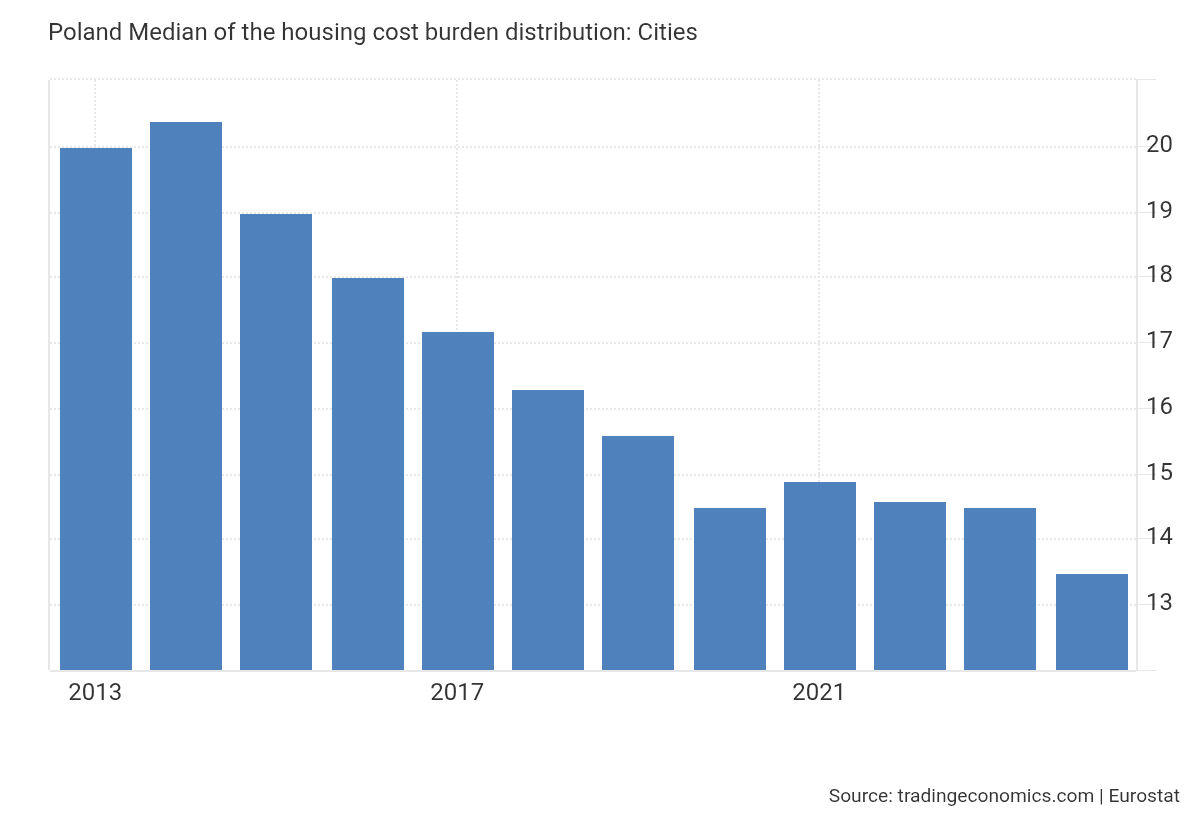
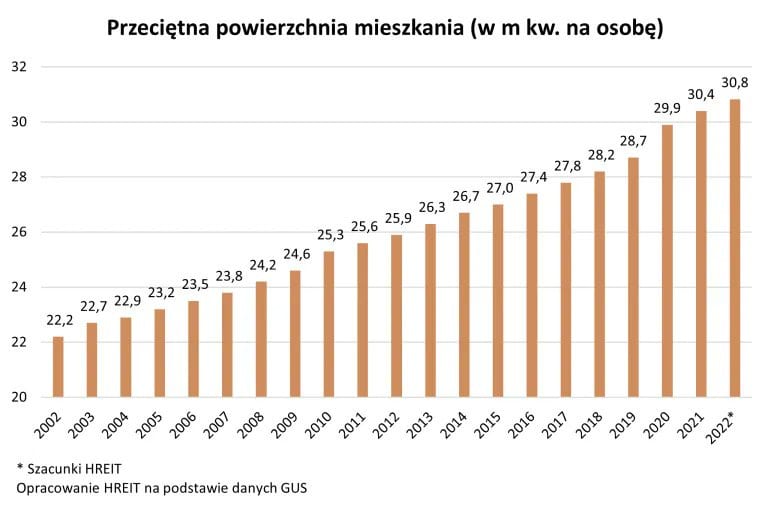
(54:04) Poland
---
First published:
July 4th, 2025
Source:
https://www.lesswrong.com/posts/wuoTsXoe93mXavofB/housing-roundup-12
---
Narrated by TYPE III AUDIO.
---
Images from the article:


The article is from Pew and includes architectural illustrations demonstrating single-stairway designs in apartment buildings, with safety data from multiple cities over a 12-year period." style="max-width: 100%;" />
Apple Podcasts and Spotify do not show images in the episode description. Try Pocket Casts, or another podcast app.
