Listen

Description

It's been about a year since the last one of these. Given the long cycle, I have done my best to check for changes but things may have changed on any given topic by the time you read this.

The NEPA Problem

NEPA is a constant thorn in the side of anyone attempting to do anything.

A certain kind of person responds with: “Good.”

That kind of person does not want humans to do physical things in the world.

  1. They like the world as it is, or as it used to be.
  2. They do not want humans messing with it further.
  3. They often also think humans are bad, and should stop existing entirely.

  4. Or believe humans deserve to suffer or do penance.
  5. Or do not trust people to make good decisions and safeguard what matters.
  6. To them [...]

---

Outline:

(00:21) The NEPA Problem

(01:53) The Full NEPA Solution

(02:43) The Other Full NEPA Solution

(03:59) Meanwhile

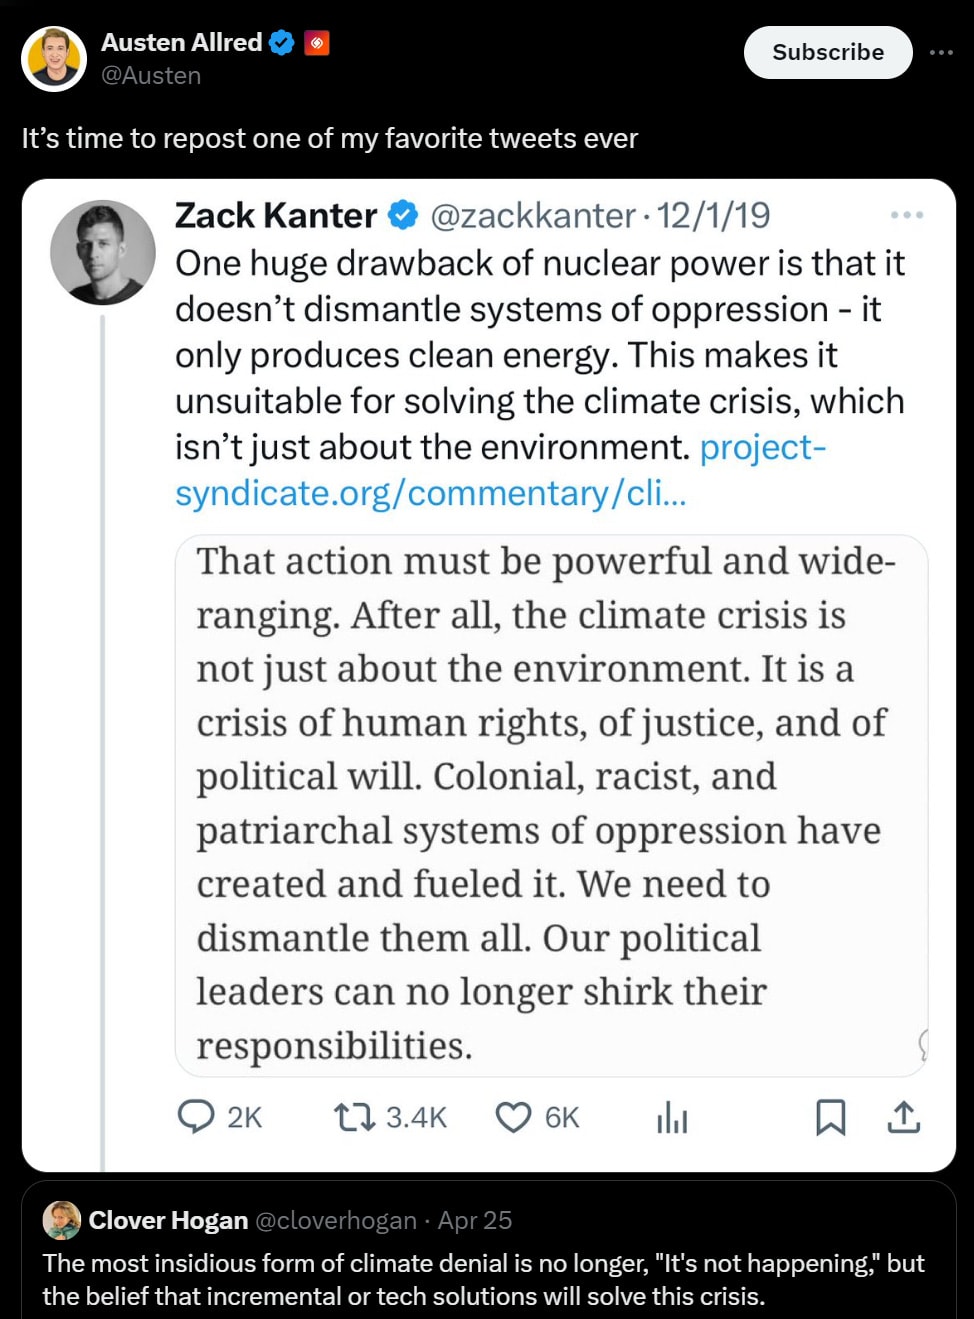
(06:06) Yay Nuclear Power

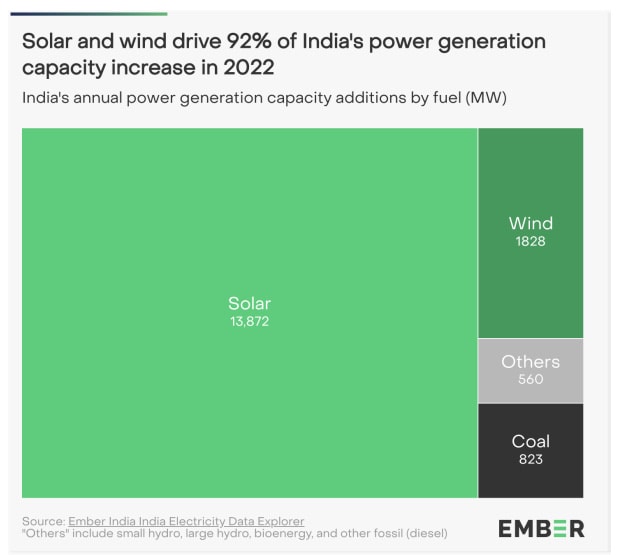
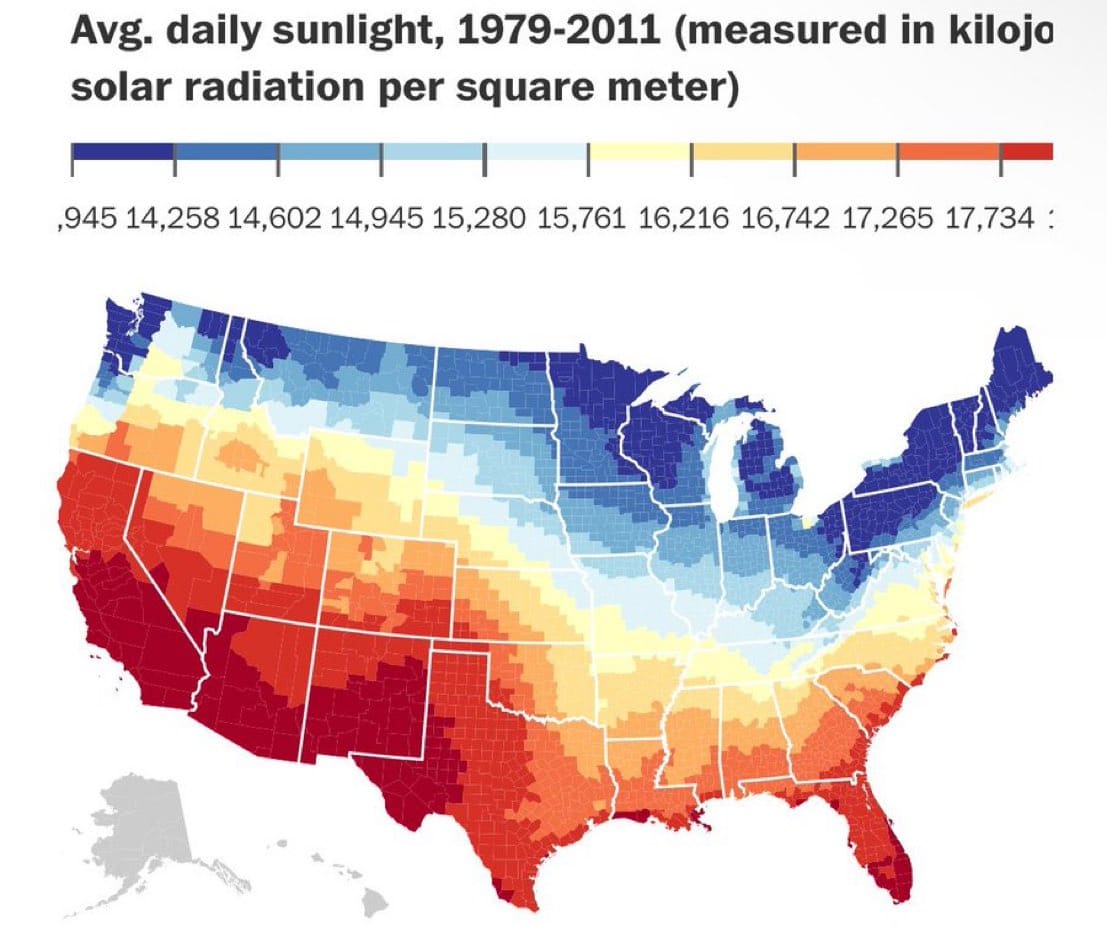
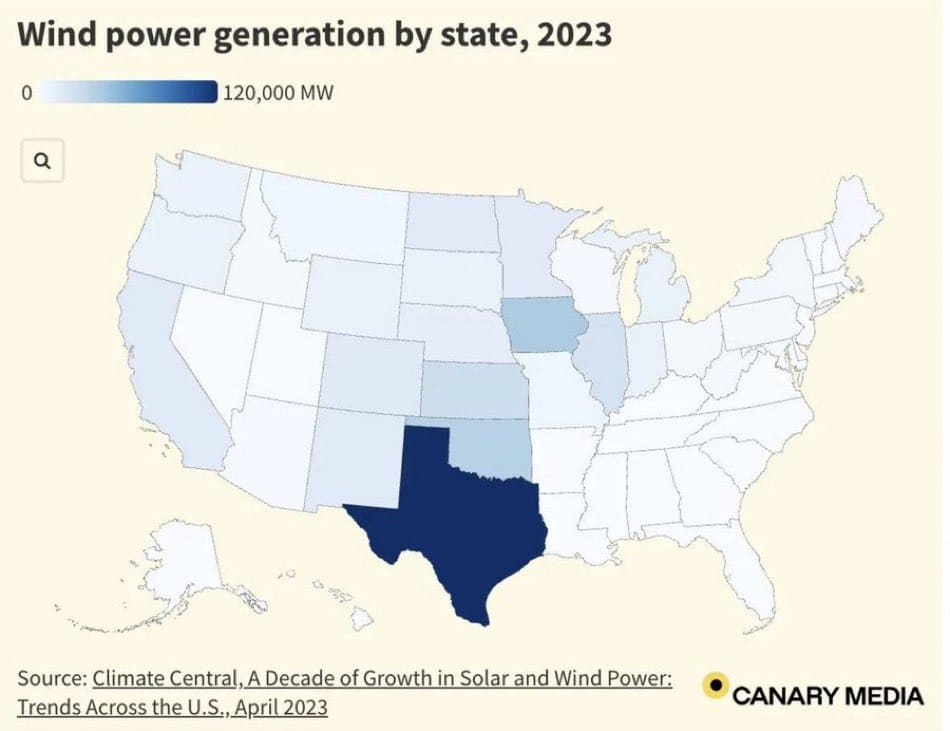
(14:22) Yay Solar and Wind Power

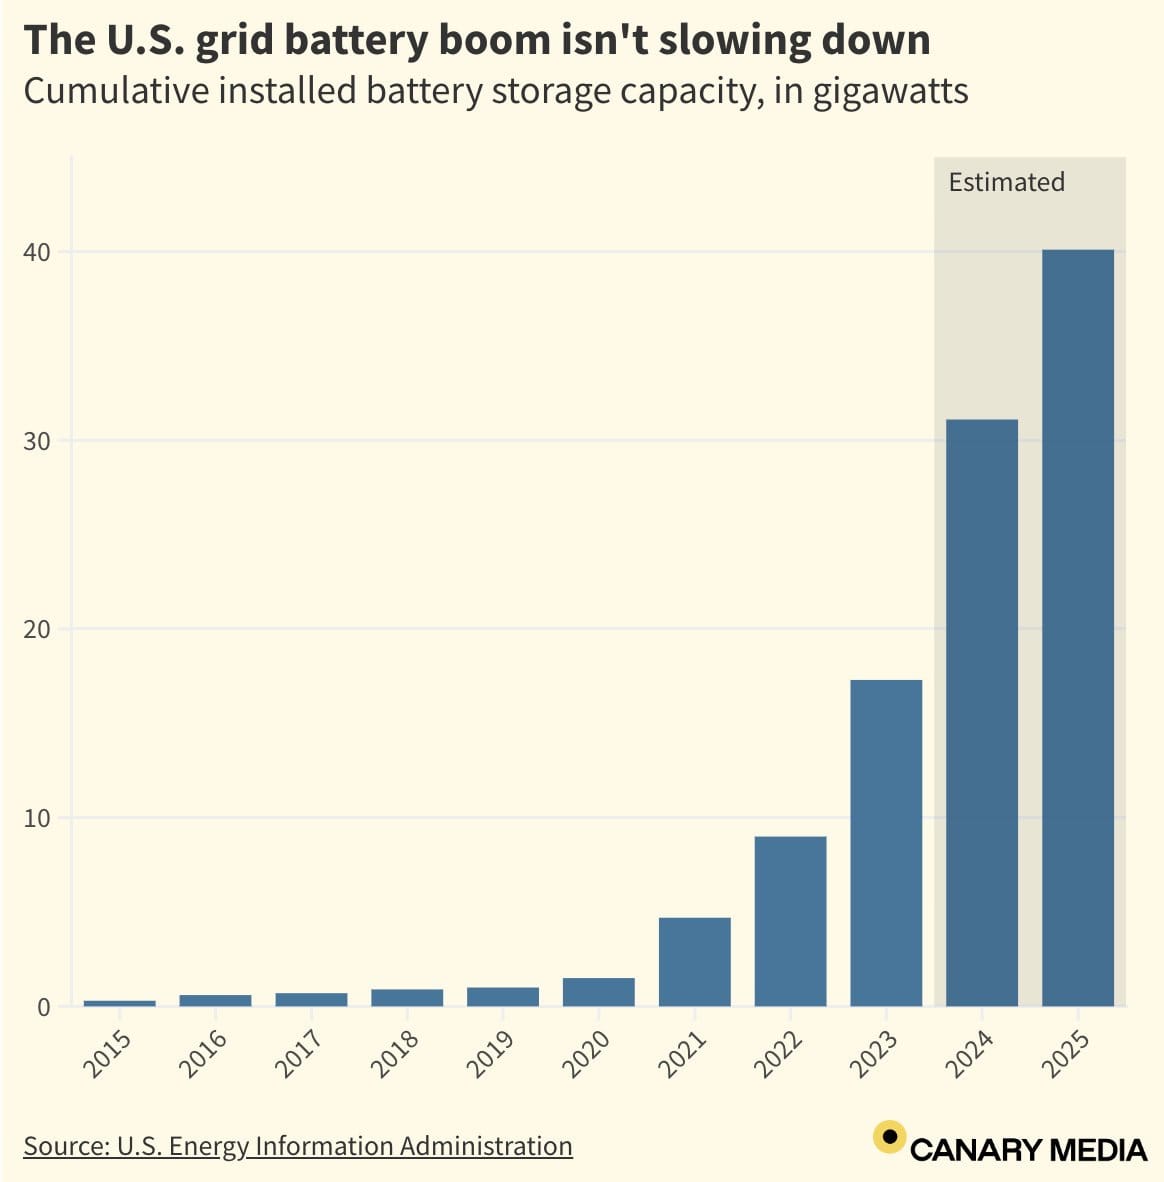
(18:11) Yay Grid Storage

(18:42) Yay Transmission Lines

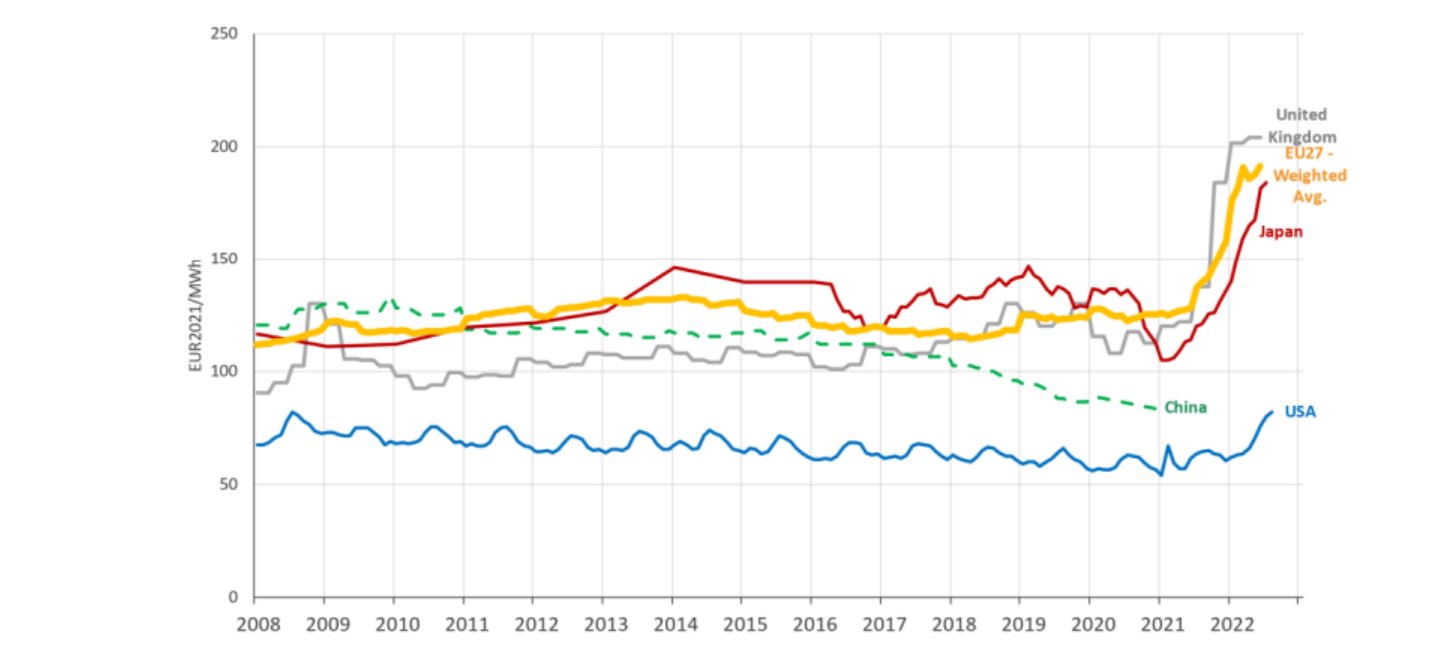
(19:40) American Energy is Cheap

(20:48) Geoengineering

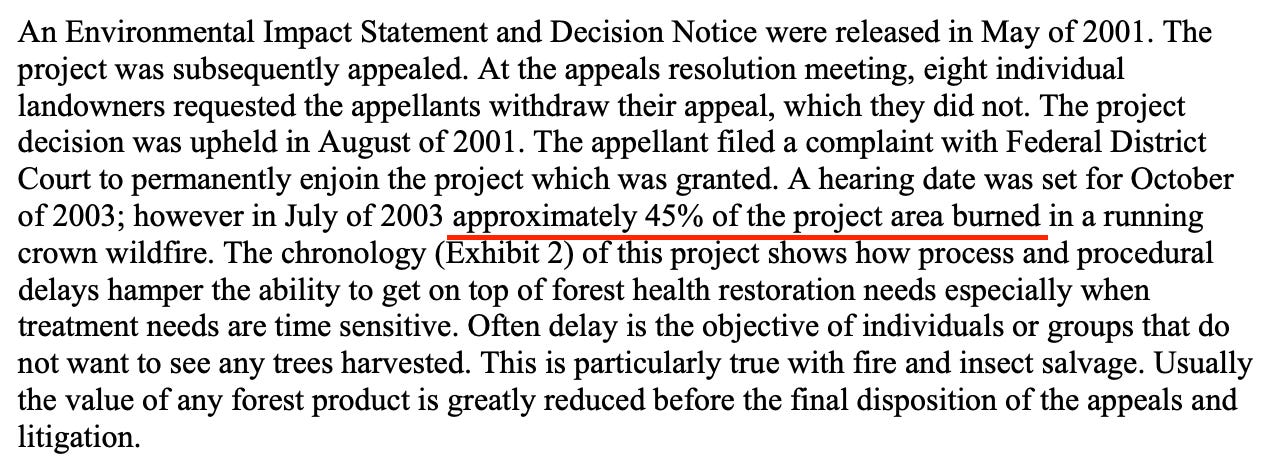
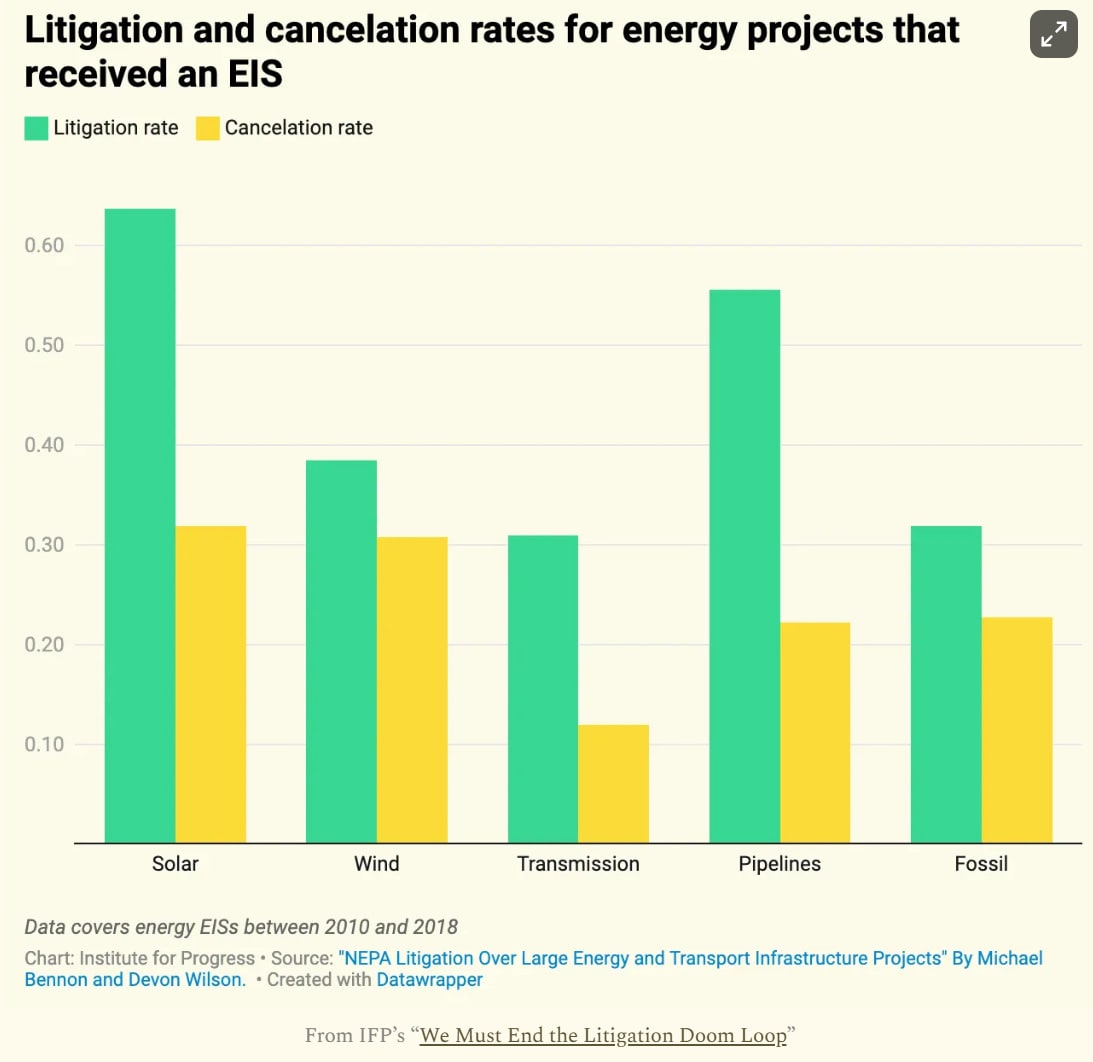
(22:29) NEPA Standard Procedure is a Doom Loop

(25:34) Categorical Exemptions

(26:13) Teachers Against Transportation

(32:41) Also CEQA

(36:36) It Can Always Be Worse

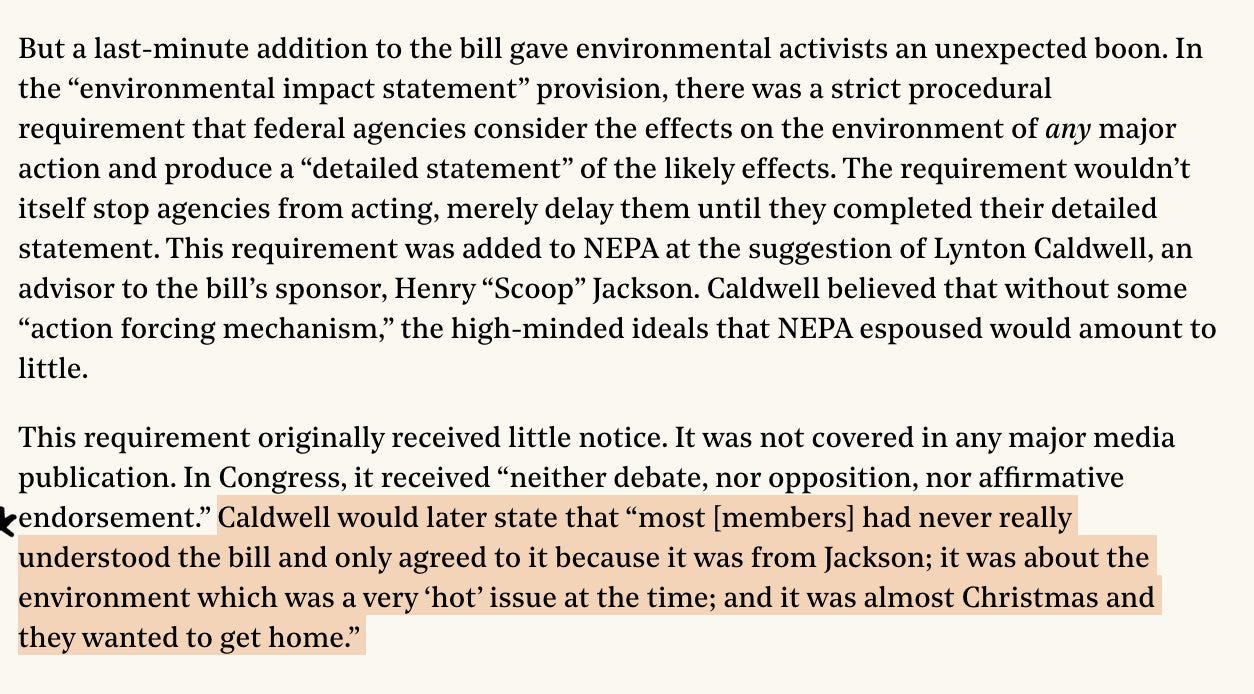
(39:35) How We Got Into This Mess

(41:00) Categorical Exclusions

(47:23) A Green Bargain

(54:18) Costs Versus Benefits

(55:27) A Call for Proposals

(56:18) The Men of Two Studies

(59:55) A Modest Proposal

---

First published:

October 8th, 2025


Source:

https://www.lesswrong.com/posts/HqAJyxhdJcEfhH2nW/nepa-permitting-and-energy-roundup-2

---

Narrated by TYPE III AUDIO.

---

Images from the article:

Bar graph showing U.S. grid battery storage capacity growth from 2015-2025.
Legal document from Cornell Law School outlining building rehabilitation conditions and regulations.
Donut chart showing India's 2022 electricity generation capacity, dominated by coal.
Graph showing electricity prices in major economies from 2008-2022 (EUR/MWh).
Comic panel showing dialogue between Spider-Man and dinosaur-like villain about DNA technology.
Several thick white binders containing environmental assessment documents with MTA branding.
Tree map visualization showing India's 2022 power generation capacity additions, dominated by solar and wind.
Bar graph showing litigation and cancelation rates for different energy projects with EIS (2012-2018).
Legal document header page from U.S. District Court of Arizona, Tucson Division.
Pie chart:
A context note about MTA's environmental impact statement on congestion pricing.
Text excerpt from a news article about an environmentalist's work in conservation, detailing their activism in the Mojave Desert, Utah, Montana, and their opposition to various development projects.
Map showing average daily sunlight across United States regions (1979-2011)</p><p>The map uses a color gradient from dark blue (lowest sunlight) in the northern regions to dark red (highest sunlight) in the southwestern states, measured in kilojoules of solar radiation per square meter.
This is a multi-panel meme using progressive reaction images showing increasing excitement/anger about emission-free electricity and its environmental impacts. The text progression discusses nuclear power's benefits while ironically noting environmentalists' opposition to it.
News article screenshot. The headline reads:

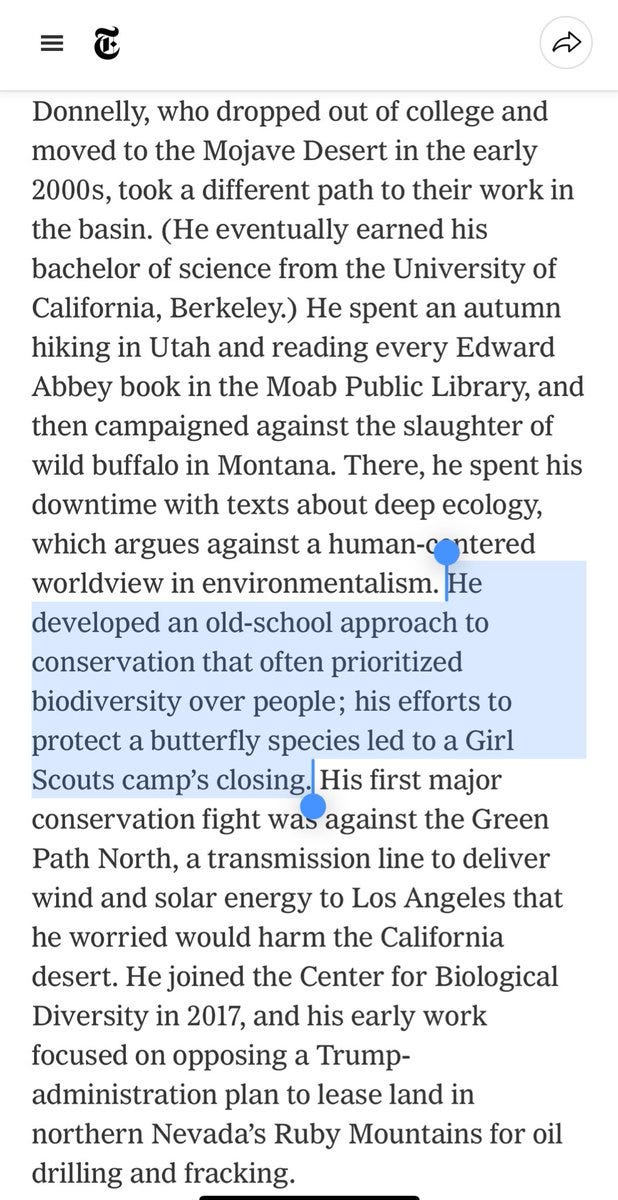
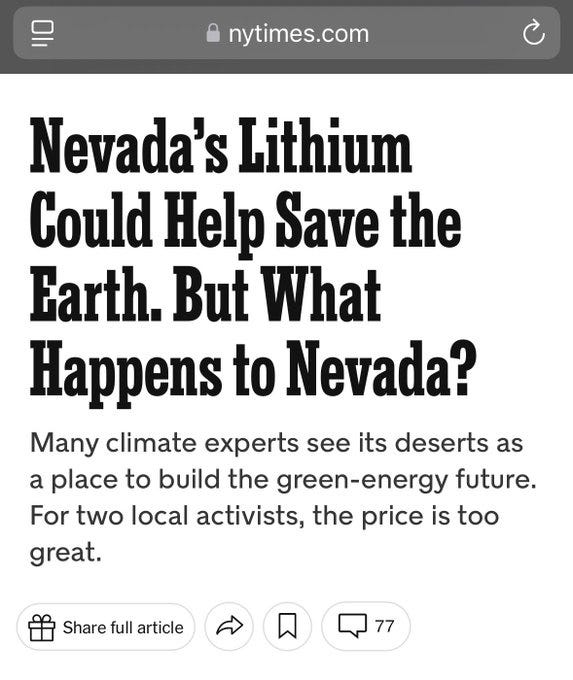
Subheading: "Many climate experts see its deserts as a place to build the green-energy future. For two local activists, the price is too great."" style="max-width: 100%;" />


Map showing wind power generation across U.S. states in 2023, Texas dominates.
Text excerpt discussing the environmental impact statement requirement in NEPA legislation and its historical context.</p><p>The passage details how a last-minute addition requiring federal agencies to produce detailed environmental impact statements became an important procedural requirement, despite receiving little attention when added to the bill. It also mentions Lynton Caldwell's role in suggesting this addition.
Text excerpt describing procedural delays affecting forest health restoration, highlighting wildfire damage and appeals process.</p><p>This passage specifically discusses a project timeline from 2001-2003, where legal proceedings and appeals ultimately delayed forest treatment until a wildfire burned 45% of the project area.
Community Notes tweets:
Austen Allred tweets:
Bar graph showing litigation and cancellation rates for energy infrastructure projects, 2010-2018.</p><p>The graph compares five energy sectors: solar, wind, transmission, pipelines, and fossil fuels, with green bars representing litigation rates and yellow bars showing cancellation rates.
Pie chart titled

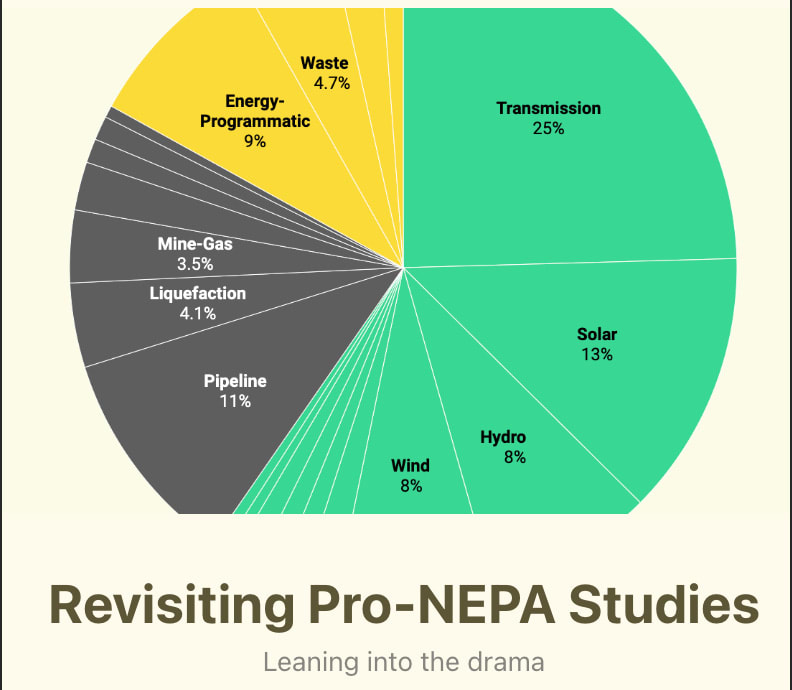
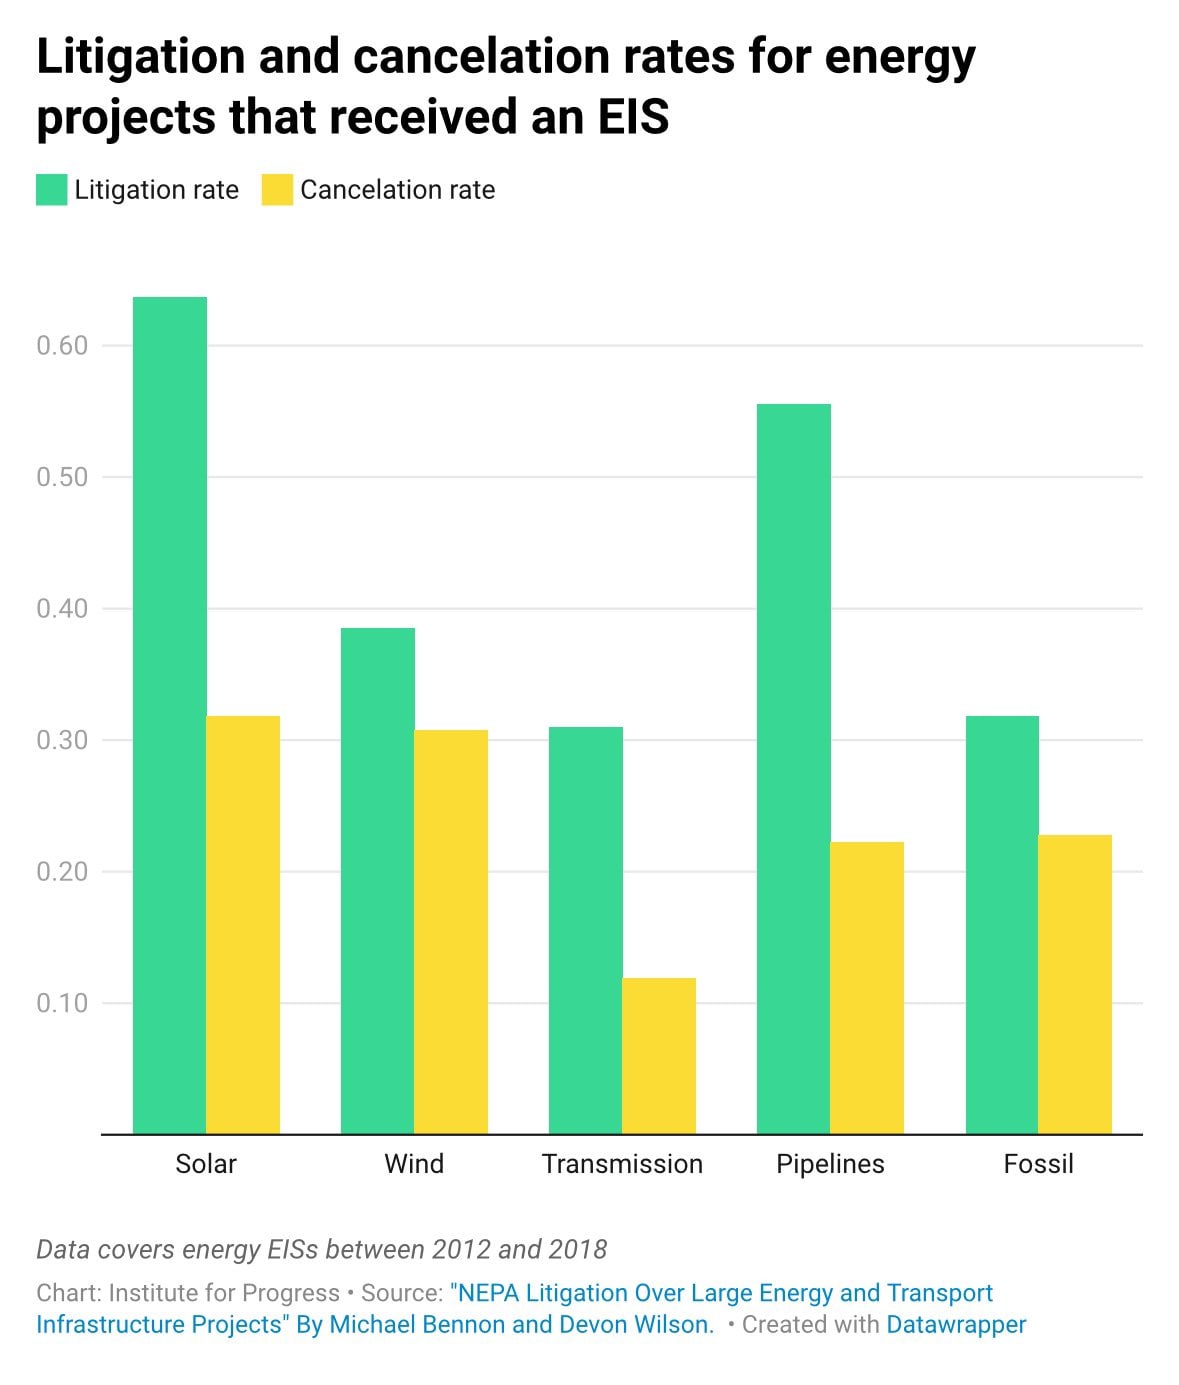
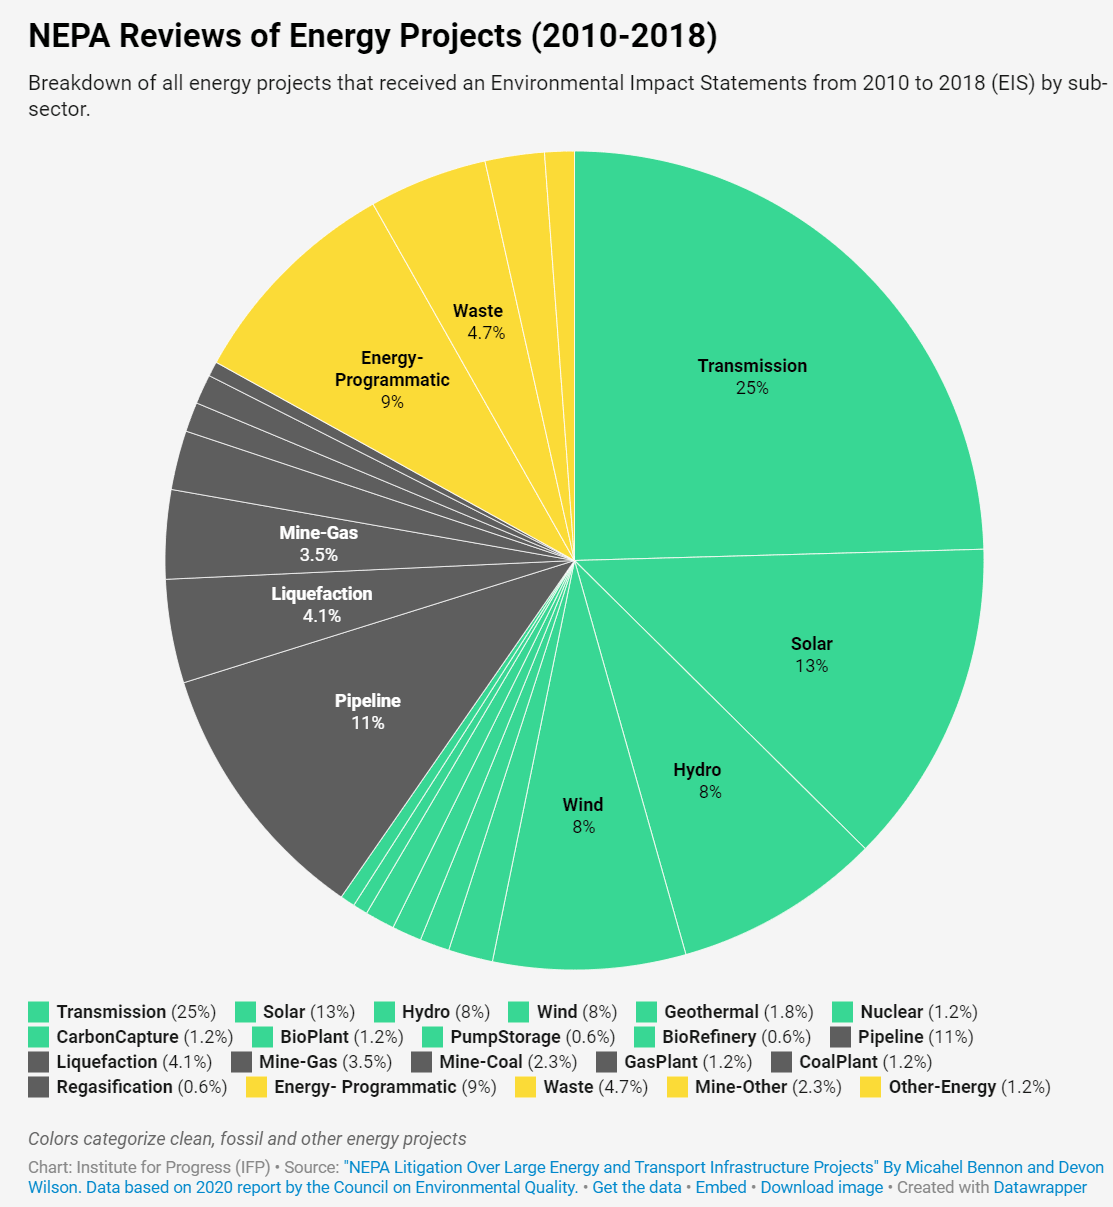
The chart divides into transmission (25%), solar (13%), pipeline (11%), and other smaller segments including wind, hydro, and energy-programmatic components." style="max-width: 100%;" />


Blue shipping container-like storage unit with four darker horizontal bands
Cartoon emoji construction worker wearing blue hard hat and glasses.

Apple Podcasts and Spotify do not show images in the episode description. Try Pocket Casts, or another podcast app.