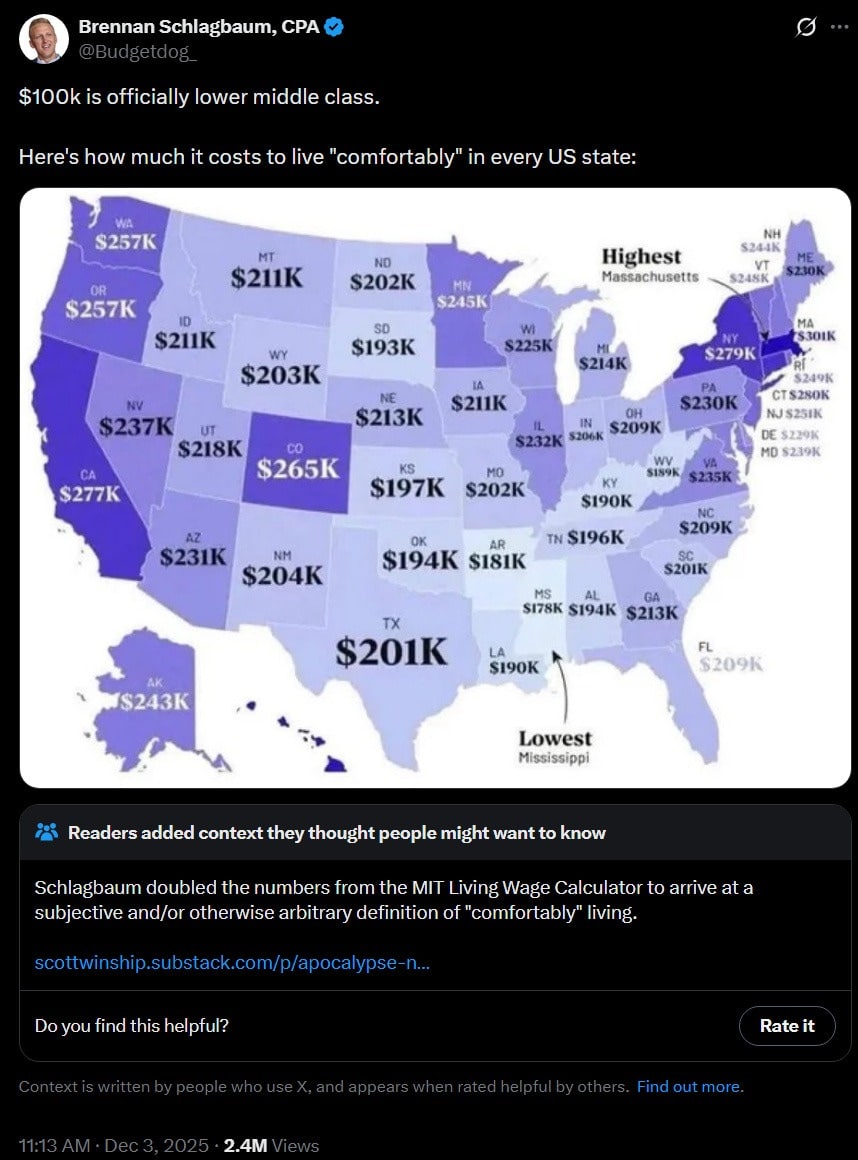
There was a no good, quite bad article by Michael Green that went viral. The condensed version was entitled ‘The Valley of Death: Why $100,000 Is the New Poverty,’ and a follow-up here.
His actual claim in that post, which was what caught fire, was that the poverty line should be $140,000, and even that this number is him ‘being conservative.’
Obviously that is not remotely true, given that:
Today's post covers this narrow question as background, including Green's response.
If you’ve already had your fill of that, including ‘well, yes, obviously, how are we bothering with all this, I know it went viral but someone was being Wrong On The Internet’ then you are not wrong. You can safely skip this post. It's fine.
I’m writing this as a lead-in to broader future discussions of the underlying questions:
---
Outline:
(01:51) None Of This Makes Any Sense
(03:40) Let's Debunk The Whole Calculation Up Front
(07:52) The Debunking Chorus
(12:12) Okay It's Not $140k But The Vibes Mean Something
(13:34) Needing Two Incomes Has A High Cost
(17:31) I Lied...
(21:41) ...But That's Not Important Right Now
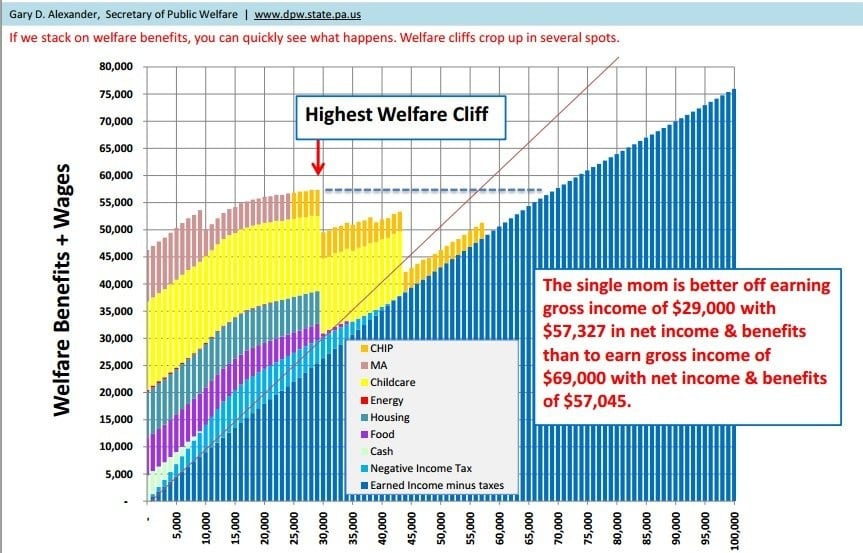
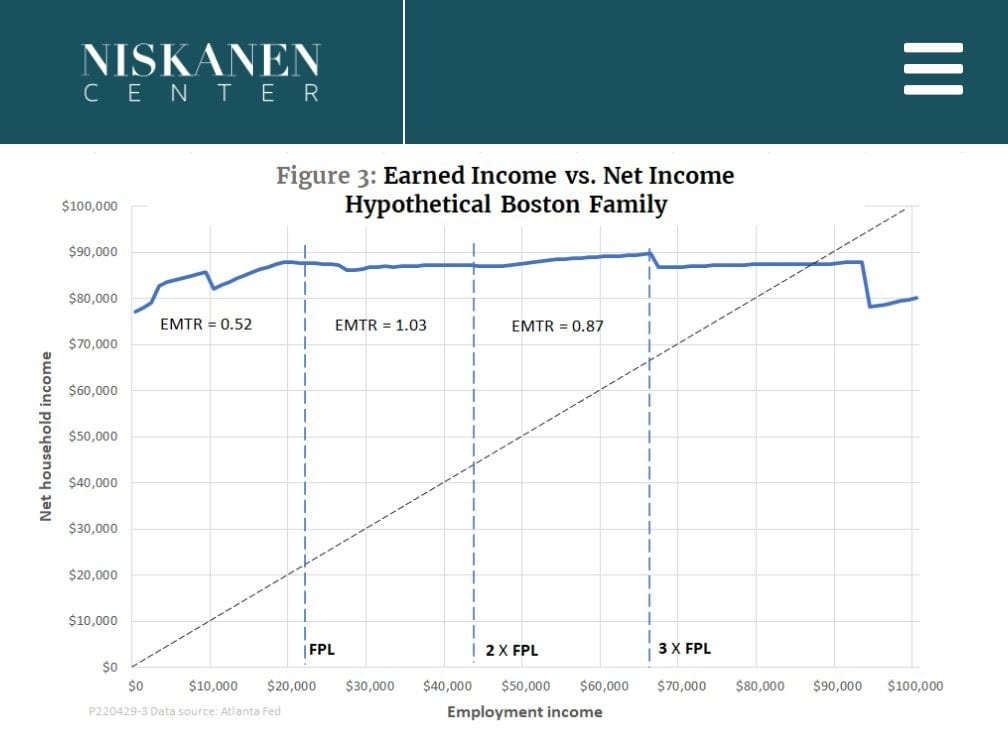
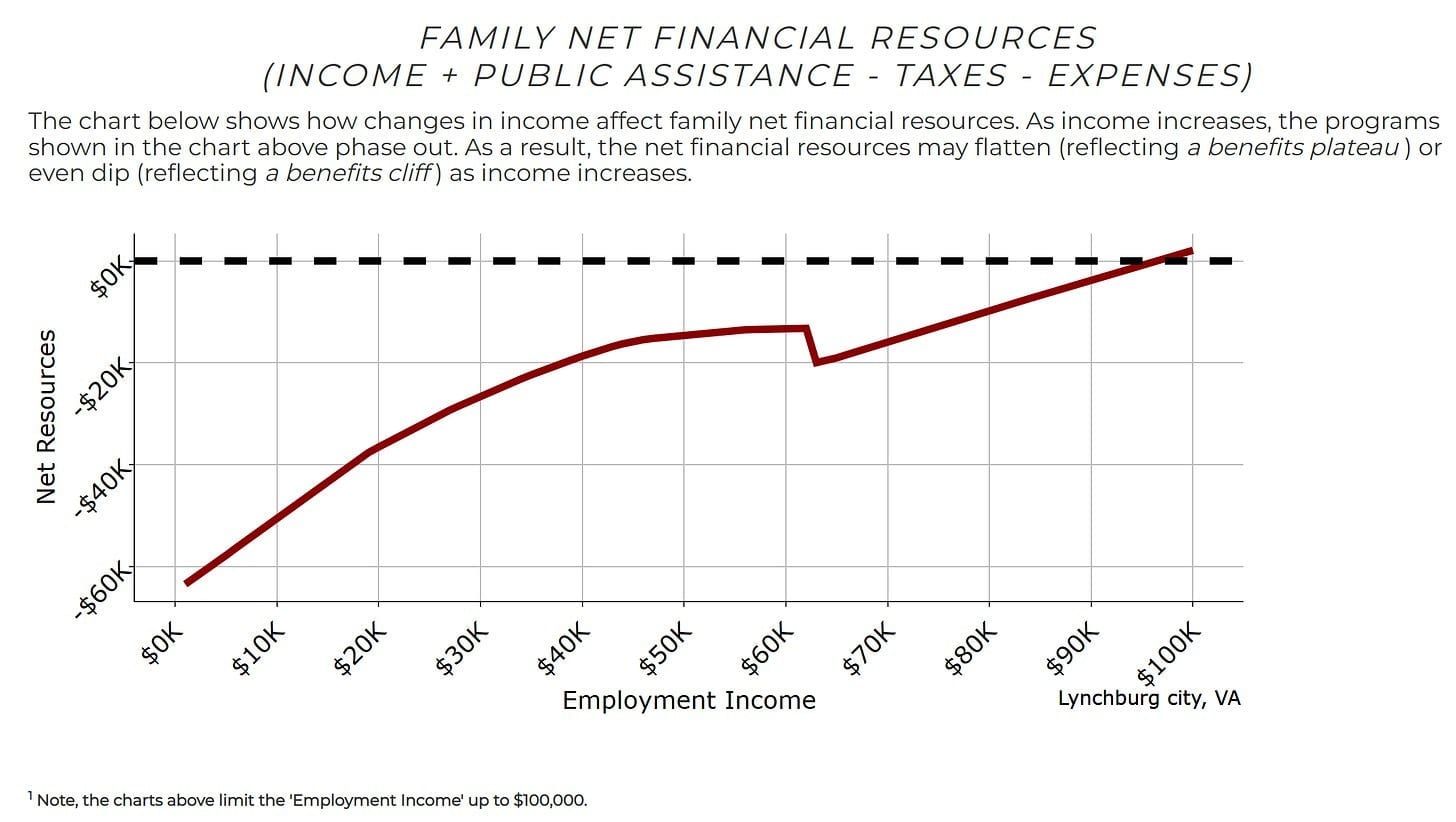
(21:55) Poverty Trap
(24:48) Poverty Trap Versus Poverty Line
(28:04) Double or Nothing
The original text contained 1 footnote which was omitted from this narration.
---
First published:
December 16th, 2025
Source:
https://www.lesswrong.com/posts/8TWLyvjA6Qsb62dAJ/the-usd140-000-question
---
Narrated by TYPE III AUDIO.
---
Images from the article:

Apple Podcasts and Spotify do not show images in the episode description. Try Pocket Casts, or another podcast app.
