Shows

The Automated Daily - Hacker News EditionUn programme DOS de 16 octets & OpenAI après la crise Altman - Actualités Hacker News (24 mai 2026)Merci de soutenir ce podcast en visitant nos sponsors:
- Conception assistée par l'IA sans effort pour des présentations, des sites web et bien plus avec Gamma - https://try.gamma.app/tad
- Consensus: IA pour la recherche. Obtenez un mois gratuit - https://get.consensus.app/automated_daily
- Investissez comme les professionnels avec StockMVP - https://www.stock-mvp.com/?via=ron
Soutenez directement The Automated Daily:
Offre-moi un café: https://buymeacoffee.com/theautomateddaily
Sujets du jou...
2026-05-2407 min
Les cafés Power BI25) DataViz Power BI World Championship FinalistNous somme avec Aanor Le Gouic pour ce 25ième épisode centré sur la DataViz et particulièrement quelles pratiques sont aujourd'hui récompensées dans des championnats de Data Viz Power BI.
2026-05-1936 min
Science Research WeeklyBack for More Science (Season 5: Episode 1)Science Research Weekly is back, with new content, deeper dives, and all the science updates you’ve been craving. This week, from viruses in space to 3D visualizations of automotive undercarriages, we’re covering scientific articles, preprints, software, blogs, and grant opportunities. Science On.References:https://journals.plos.org/plosbiology/article?id=10.1371/journal.pbio.3003568https://www.nature.com/articles/s41587-025-02962-9https://www.nature.com/articles/s41586-025-09971-3https://www.jstatsoft.org/issue/view/v115https://arxiv.org/pdf/2601.14213ht...
2026-01-2611 min
Chaos Computer Club - recent audio-only feedWhat Makes Bike-Sharing Work? Insights from 43 Million Kilometers of European Cycling Data (39c3)Bike- and e-bike-sharing promise sustainable, equitable mobility - but what makes these systems successful? Despite hundreds of cities operating thousands of shared bikes, trip data is rarely public. To address this, we built a geospatial analysis pipeline that reconstructs trip data from publicly accessible system status feeds. Using this method, we gathered **43 million km** of bike-sharing trips across **268 European cities**. Combined with over **100 urban indicators** per city, our analyses reveal how infrastructure, climate, demographics, operations, and politics shape system performance. We uncover surprising insights - such as why some e-bike systems underperform despite strong demand - and highlight how cities...
2025-12-2940 minChaos Computer Club - recent events feed (high quality)What Makes Bike-Sharing Work? Insights from 43 Million Kilometers of European Cycling Data (39c3)Bike- and e-bike-sharing promise sustainable, equitable mobility - but what makes these systems successful? Despite hundreds of cities operating thousands of shared bikes, trip data is rarely public. To address this, we built a geospatial analysis pipeline that reconstructs trip data from publicly accessible system status feeds. Using this method, we gathered **43 million km** of bike-sharing trips across **268 European cities**. Combined with over **100 urban indicators** per city, our analyses reveal how infrastructure, climate, demographics, operations, and politics shape system performance. We uncover surprising insights - such as why some e-bike systems underperform despite strong demand - and highlight how cities...
2025-12-2940 minChaos Computer Club - recent events feed (low quality)What Makes Bike-Sharing Work? Insights from 43 Million Kilometers of European Cycling Data (39c3)Bike- and e-bike-sharing promise sustainable, equitable mobility - but what makes these systems successful? Despite hundreds of cities operating thousands of shared bikes, trip data is rarely public. To address this, we built a geospatial analysis pipeline that reconstructs trip data from publicly accessible system status feeds. Using this method, we gathered **43 million km** of bike-sharing trips across **268 European cities**. Combined with over **100 urban indicators** per city, our analyses reveal how infrastructure, climate, demographics, operations, and politics shape system performance. We uncover surprising insights - such as why some e-bike systems underperform despite strong demand - and highlight how cities...
2025-12-2940 minChaos Computer Club - recent events feedWhat Makes Bike-Sharing Work? Insights from 43 Million Kilometers of European Cycling Data (39c3)Bike- and e-bike-sharing promise sustainable, equitable mobility - but what makes these systems successful? Despite hundreds of cities operating thousands of shared bikes, trip data is rarely public. To address this, we built a geospatial analysis pipeline that reconstructs trip data from publicly accessible system status feeds. Using this method, we gathered **43 million km** of bike-sharing trips across **268 European cities**. Combined with over **100 urban indicators** per city, our analyses reveal how infrastructure, climate, demographics, operations, and politics shape system performance. We uncover surprising insights - such as why some e-bike systems underperform despite strong demand - and highlight how cities...
2025-12-2940 min
Déclic dataL'Art de la Dataviz : du Storytelling à l'Impact ( Alice Leneveu, Alticap)Vous pensez que la dataviz (data visualisation) se résume à des graphiques colorés ? Détrompez-vous. Dans cet épisode, nous plongeons au cœur de l’art de transformer des données en histoires qui révèlent le sens des données et marquent les esprits. Avec Alice Leneveu, Consultante décisionnel chez Alticap, découvrez comment le design, la simplicité et une bonne dose de créativité peuvent transformer vos données en récits visuels percutants qui parlent à vos utilisateurs.Au prog...
2025-11-1840 min
A Founder's LifeWhat Every Founder Needs to Know About Balance - Marc Kerrest - S2 - E17What if the data you’re tracking could change your life—personally and professionally?In this episode of A Founder’s Life, Leo Gestetner sits down with Marc Kerrest—founder and CEO of GPS DataViz—to explore how data is transforming elite sports, behavior change, and the entrepreneurial journey. From launching a startup that now works with the NFL and European football clubs, to navigating a neck injury that redefined his priorities, Marc shares a powerful story of growth, humility, and purpose.Whether you’re a founder, athlete, or simply curious about how data can shape habits...
2025-07-2818 min
The Elevate Data Visualization Show#28 - The End of Innovative DataViz? What's Really Happening in the IndustryIn this episode of the Elevate Dataviz Show, Will, Duncan, and Alli tackle the provocative question: "Is innovation dead in data visualization?" Inspired by recent articles from Shirley Wu and Moritz Stefaner, they explore how the field has evolved from the experimental golden age of 2012-2016 to today's more practical landscape.
2025-05-2158 minThe Elevate Data Visualization Show#29 - Behind-the-Scenes of Creating Charts for VoxToday on the show, Gabby will take us behind-the-scenes of her creative process for the data visualizations she created for Vox. Some people loved it, and some people loved to hate it! Let's hear Gabby's take...
2025-05-211h 00The Elevate Data Visualization Show#25 - Redefining Success in Data Visualization Design: Our 2024 Reality CheckThree established data designers share their raw experiences with burnout, career pivots, and finding sustainable success in 2024. A candid conversation about choosing creativity and balance over constant growth.
2025-01-251h 01The Elevate Data Visualization Show#26 - Is Data Viz Still a Career? 4 Expert ViewsEver wonder what REALLY happens in a data viz career? Four industry veterans reveal how their paths evolved far beyond making charts. From product design to environmental storytelling, education to branding - discover the unexpected opportunities when you combine data visualization with other skills. Perfect for anyone curious about the real future of data viz careers.
2025-01-2557 minThe Elevate Data Visualization Show#24 - Will Chase on data journalism and career transitionsWill Chase tell us everything about going from researcher to Data Visualization Senior Editor at Axios, how to build long scroll data story and what's next in his career.
2024-10-1951 minThe Elevate Data Visualization Show#24 - Duncan Geere on Handling Finances for Work/Life Balance, Transitioning to Dataviz and Creating a Data Sonification StudioIn this episode, we'll hear what Duncan Geere has been up to for the last few years! We'll talk about work/life balance, how to take a month off of work, how to be featured in major news outlets, and how he has been setting up a data sonification studio.
2024-09-1958 min
The PolicyViz PodcastBridging Data Gaps: Nancy Organ on Making Data Visualization Accessible for All AgesIn this final episode of the season, I welcome Nancy Organ to the show to discuss her new book Data Visualization for People of All Ages. Nancy’s book aims to make dataviz accessible to everyday readers. Our conversation highlights the importance of not altering data simply for aesthetics but to facilitate understanding. We also explore balancing creativity with informed design choices, and suggest alternatives to traditional graphs, such as infographics, timelines, flowcharts, and diagrams.Keywords: data, dataviz, data visualization, data visualization, bridging data gaps: nancy organ, data gaps: nancy organ on making data visualization, data visualization access...
2024-06-2637 minLes cafés Power BI#2 Les erreurs en DataVizOn met à plat tout ce qu'on pense sur la DataViz : esthétisme, modes, structure des rapports, subjectivité, niveau des utilisateurs, nos ressources pour aller plus loin, etc..
2024-05-3027 minData Viz Today95: You Need to Try Something New to Be Someone NewIn this episode, I share the introduction of my book, Chart Spark, to inspire you to take the first steps towards a more fulfilling career, whether you're trying to transition into dataviz or integrate more creativity into your work. I'll redefine what creativity means, share why you need it in your dataviz work, show you how to cultivate a powerful creative practice, and finally, I share my personal story of having a fractured career at age 30 and turning it all around — including what everyone's calling the oh-so-relatable "trash can story". Grab a copy of my new...
2024-05-2920 min
The Art of Communicating DataAsking a Tableau Visionary Questions in DataViz - An Interview with Neil RichardNeil Richards answers questions we have about data visualization, including how to approach data viz competitions, how to use blank space in our design, when to let the data speak for itself vs. craft a data story, and more.
In addition to being a 5x Tableau Visionary and Hall of Famer, Neil is the author of Questions in DataViz, which is the title of both his blog and book.
Got more data viz questions? You can connect with him on LinkedIn and X.
2024-05-1623 min
CFO BookshelfYouTube's Top Dataviz and Tableau InfluencerMy favorite go-to person on all matters, Tableau and Dataviz, is Andy Kriebel.Andy was the first person to create a YouTube channel on Tableau. His subscriber base has surpassed 61,000, and his 750+ videos have 7.5 million views and counting.Andy is the co-author with Eva Murray of the book #Makeover Monday, and you can also follow his informative and insightful helpful hints each day on LinkedIn.In this conversation, we find out why Andy has been publishing online for more than ten years, why asking for a dashboard is rarely the right starting point...
2024-04-2743 minThe Elevate Data Visualization Show#23 - Building a Passion-Fueled Information Design Studio with Gabrielle MeriteIn this episode, Gabrielle Merite speaks about her journey in building a collaborative, team-oriented creative agency.
2024-04-191h 00The PolicyViz PodcastCharting New Horizons: Amanda Makulec on Leadership, Community, and the Human Touch Behind DataVizAmanda Makulec is the current Executive Director of the Data Visualization Society (DVS), and in this week’s episode of the PolicyViz Podcast, we discuss her journey and the DVS’s evolution as it approaches its fifth anniversary. Amanda shares her experience starting as a volunteer all the way to leading the entire organization. With her second term coming to an end, she emphasizes the importance of term limits and her commitment to ensuring the organization’s sustainability by focusing on operational systems, finances, compliance, and community responsiveness.Keywords: charting new horizons: amanda makulec on leadership, amanda makule...
2024-04-1136 minData Viz Today93: How to Leverage Sports Analytics for a Standout Dataviz Portfolio — Featuring Shri KhalpadaAre you looking for ways to make your work stand out in a crowded industry, like sports? Or maybe looking for a topic with pretty clean data to create a portfolio project? In today's episode, we're chatting with Shri Khalpada, a D.C. area creative coder and Principal Software Engineer at Cleaning the Glass, which is an NBA analytics website founded by Ben Faulk that's available to the public and also has more robust tools for NBA teams. Shri shares how he increased his chances of landing a coveted sports analytics job, and a few lessons he's learned working...
2024-03-2934 minThe Elevate Data Visualization Show#22 - How to Present Your Dataviz Ideas to a ClientIf you present an idea to your client and ask, "So, what do you think?" then you likely know what follows: non-specific and confusing feedback! What should you say instead? We share how we present ideas to clients and how to get the best feedback!
2024-03-2457 minThe Elevate Data Visualization Show#21 How to Overcome Creative Blocks in Data VisualizationIn this episode, we share how we approach a creative project, where we find inspiration, and what we do when we get stuck!
2024-03-2356 minThe Elevate Data Visualization Show#20 How to Create a Dataviz BookCurious about the process of writing a book? Alli Torban shares her experience, including: What's included in a book proposal, how advances and royalties work, what was harder/easier than expected, and much more!! Buy her new book here: https://www.chartsparkbook.com
2024-03-2358 min
Insights x DesignInsights x Design Ep. 12 (Eli Holder)
Insights x Design is a data design consulting firm that removes the friction between information and insights.
Eli's links:
Design practice: https://3iap.com
Bluesky: https://bsky.app/profile/elibryan.bsky.social
Workshop on equity-oriented dataviz: https://3iap.com/workshops/equity-dataviz/
Writeup on dataviz + social stereotyping research: https://3iap.com/unfair-comparisons
Writeup on polling viz + social influence research: https://3iap.com/pol3
Effect Affect, with Gabby Merite: https://effaff.com
Affiliates:
Analyst Builder: https://www.analystbuilder.com/?via=andrew-madson
Data Camp: https://datacamp.pxf.io/4PMO00
Coursera: https://imp.i384100.net/Y9vxVq
Data Science Infinity: https://data-science-infinity.teachable...
2024-03-1646 minData Viz TodayBONUS: Insider Tips for Publishing Your First Dataviz BookAre you ready to write a book? Or maybe see it in your future down the road? Well, I spent hours and hours researching the book publishing process, spoke with tons of authors about their experience, and then lived through it myself. I want to save you some time and share what I learned. Recently I shared all about the process with the Elevate Dataviz Learning Community that I co-founded and I'm sharing that conversation here today… In this episode, I share what's included in a book proposal, how advances and royalties work, what was ha...
2024-02-281h 00Data Viz Today92: How to Navigate a Dataviz Career in Mozambique — Featuring Charama SulemaneHave you ever felt like you made a big career mistake? Like you completely chose the wrong college major or took the wrong job. Well, today we're chatting with Charama Sulemane, a data analyst at the United Nations Office for Project Services. But only a few years ago, he was a fresh graduate in Mozambique and found out that no one was hiring for data science jobs in his area. He was questioning his decision to get into this field. But not ready to give up, Charama made a few smart moves that landed him his first job in d...
2024-01-3022 minThe Elevate Data Visualization Show#19 Approaching goal settings in the new yearIn this episode, we share how we each approach goal setting for the new year, how 2023 went, and what our goals are for 2024!
2024-01-1159 minThe Elevate Data Visualization Show#18 No topic for a personal project? Here is how to find one.Do you want to create a dataviz personal project but not sure what topic to use? Is it holding you back from starting?! In this episode, we'll share what topics we've used in the past that have worked, and tips for finding a good topic for you to start with!
2024-01-1058 min
Data Viz Today91: AMA — Creativity, freelancing, dataviz process and more!In this episode, I answer some common questions I've received lately about creativity, freelancing, dataviz process, and more. Let's go! What platforms would you join when on the look out for a network, freelance projects etc? I want to transition into a dataviz job but not sure where to start? What exactly do you mean by 'creativity' in the context of data and analytics? How can data people be creative? How do you respond to negative feedback of your creative idea? What do you do when you feel unmotivated?
2023-12-2116 min
Data Viz TodayBONUS: Wanna chat? ☕ I'm opening up my calendar!Hey dataviz friend, my book is launching in early December (CHART SPARK), and after giving a workshop this morning that used the prompts from the book, I realized....chatting and brainstorming with other people is my happy place! So, do you wanna chat? Anything on your mind about dataviz careers, creativity, or brainstorming on a real project? I'm opening my calendar on Thursdays until the year-end for fun coffee chats. Snag a time on my calendly below. No cost or commitment required – just good vibes and chart sparks! 📊⚡ https://calendly.com/allitorban/chart-spark-virtual-coffee-chat-with-alli-torban
2023-10-3102 minThe Elevate Data Visualization Show#17 - What would you pursue if you didn't have "serious" work?If you were going to take a break from “serious” work to work on something just because it would be really interesting, what would you do?
2023-10-2059 min
Stats + StoriesData Visualization Contest Winner | Stats + Stories Episode 300After producing hundreds of episodes we have lots of data lying around. Data we made available to you, asking you to crunch the numbers for a contest that told the story of our podcast. The winner of that contest Nicole Mark joins us today on Stats+Stories.
Nicole Mark is a visual learner and communicator who found her passion in the field of data visualization. She started out making maps of imaginary worlds and cataloging her volumes of The Baby-Sitters Club on her family's original Apple Macintosh. Now, she analyzes and visualizes data in Tableau and with code, always on...
2023-10-1915 minThe Elevate Data Visualization Show#16 - 4 Dataviz Standards & Practices that We Disagree WithToday we're sharing our dataviz pet peeves. We'll each share a “best practice”, process, or way of thinking that has always bothered us in our field. What's yours?
2023-10-0131 min
Data Viz Today88: 3 Ways to Monetize Your Data and Dataviz — with Dr. Barbara WixomIn this episode, we explore Dr. Barbara Wixom's insights on the three main ways companies (or even freelancers) can monetize data and dataviz, drawing from her extensive research and the insights of her book, Data is Everybody's Business. She shares the patterns of successful data monetization gathered over 29 years and we brainstorm ways it applies to dataviz work. Also, since Barb was a client of mine, we get a sneak peek into clients' top concerns when beginning a dataviz project so we can improve our processes. Let's go! Show notes: https://dataviztoday.com/shownotes/88
2023-09-0554 min
Data HackersPower BI, Dashboards e a Carreira de Analista de Dados -Data Hackers Podcast 72Em um papo empolgante, mergulhamos no universo dos profissionais de dados e suas habilidades essenciais, com um foco especial no poderoso Power BI e demais ferramentas. Descubra, como as ferramentas de analytics, como o Power BI, estão moldando o futuro do campo de dados e análises.
Nste episódio do Data Hackers — a maior comunidade de AI e Data Science do Brasil-, conheçam as apaixonadas pela área de dados e principais referências no assunto: a Karine Lago — especialista em Business Intelligence, Power BI e Excel, premiada pela Microsoft mais de sete vezes e Escritora; e a Let...
2023-08-181h 05The Elevate Data Visualization Show#15 - A day in the Life of a Dataviz DesignerWe take you on board with our daily routine in this episode. We talk coffee, early workout and late design sessions but also little tips & tricks we use to maintain a clear schedule.
2023-07-231h 03The Elevate Data Visualization Show#14 - Ethical Considerations for Data VisualizationWe speak often about design considerations to make a good dataviz, what about the ethics of it? In this episode, we talk about considering context, people behind the data, data ownership, bothsideism and more...
2023-07-0957 minThe Elevate Data Visualization Show#13 Datasets nightmares (and how to fix them)Dirty data: common problems we encounter when we get a dataset and how we deal with it.
2023-05-2555 minThe Elevate Data Visualization Show#12 A Candid Look at Careers and Growth in the Dataviz FieldIn this episode, we share a candid look into our careers and growth in the dataviz field. How did we start out, how did things change unexpectedly, and do we see ourselves evolving out of the dataviz space?!
2023-04-2054 minThe Elevate Data Visualization Show#11 How to Choose the Right Pricing Model for Data Visualization FreelancingAre you struggling to figure out how to price your dataviz services? It can be overwhelming with so many pricing models to choose from. We'll talk about our experiences and the advantages and disadvantages of different models.
2023-03-2456 minThe Elevate Data Visualization Show#10 Pitching data-driven stories like a proIn this episode, we share how you can effectively pitch a data-driven story to a news outlet! We cover what to include, who to send it to, and what kind of response you can expect. We also touch on how a project and book proposal compare!
2023-02-151h 02
La Baz 📧 Le podcast sur l'emailChoisir sa solution de datavisualisation en 8 questions et 1 exempleLa datavisualisation vous permet de créer des tableaux de bord pour suivre toutes vos statistiques, y compris de vos campagnes emails.
Léo vous explique comment choisir le bon outil de dataviz pour optimiser vos campagnes emailing rapidement.
L’objectif de la datavisualisation est de rendre ces données accessibles et compréhensibles très rapidement via des graphiques. Elle permet aussi de gagner du temps.
Découvrez les 8 questions à se poser avant de choisir son outil de dataviz.
Léo vous présentera aussi le choix de nos équipes techniques pour...
2023-01-3003 minThe Elevate Data Visualization Show#9 Data Viz Freelancing: How to Get Prepared Before Going SoloIn this episode, we discuss what you can start doing TODAY to prepare yourself for a jump to freelancing (from being a full-time employee). We each share what we're glad we did before jumping, and what we wish we had done!
2023-01-1859 min
Data Viz Today83: Can you X-ray dataviz?What's it mean to X-ray a dataviz? This is my new method to make sure I learn from my dataviz inspiration and organize it in a way that helps me use it later. In this episode, I'll share what it is and how you can X-ray dataviz too. Let's go! Show notes: https://dataviztoday.com/shownotes/83 Join my newsletter: https://dataviztoday.com/newslettersignup
2023-01-1007 minThe Elevate Data Visualization Show#8 DataViz Reimagined: A Vision for the Field's FutureIn this week's episode of the Elevate Dataviz Show, we're rounding up 2022 - talking about what we've learnt this year and what we're looking forward to in 2023.
2022-12-1459 minThe Elevate Data Visualization Show#7 Dataviz that Captivates: How to Use Emotion to Enhance Your DesignIn this episode, we discuss emotion in dataviz. Should you use it? When and how do you use it?
2022-12-0158 min
storytelling with data podcaststorytelling with data podcast: #59 questions in dataviz with Neil RichardsWhy don’t we use triangles in charts more often? Can design considerations come before we have the data? Do we take data visualization too seriously? Author, speaker, and data literacy advocate Neil Richards raises (and occasionally answers) these and other questions in his new book, Questions in Dataviz: a Data-Driven Process for Data Visualization. In this episode, Neil stops by the podcast to talk about the value of creativity, personal passion projects, experimentation in data visualization, and whether dataviz can change the world. related links: Follow Neil: Twitter | Website | Tableau Public (portfolio) Book: Questions in Dat...
2022-11-3040 min
The Data Journalism PodcastNathan Yau: the flow of datavizNathan Yau is behind one of the world's most influential data journalism and visualisation websites: Flowing Data. A statistician, Nathan started the site as a resource for students but it has become a go-to destination to find out the latest in data journalism. We discuss why dataviz matters, how to learn R and the quiz of the week.
The music this week, made with TwoTone, is the percentage of people sleeping on a weekday in 30-minute intervals, based on the American Time Use Survey 2020
2022-11-2523 min
Data Viz TodayBONUS: How to build habits and rituals that support your creative practiceWhy are habits/rituals important to your creative practice and what are some examples? Duncan Geere, Will Chase, and I share what's been most impactful to our dataviz practice! Shownotes / watch video: https://blog.elevatedataviz.com/the-elevate-dataviz-show-6 RJ Andrew's creative rituals infographic: https://infowetrust.com/project/routines
2022-11-2259 minThe Elevate Data Visualization Show#6 DataViz Creativity: Habits and Rituals for Staying InspiredIn this week's episode of the Elevate Dataviz Show, we share our personal dataviz and freelance habits and rituals.
2022-11-1658 min
Let's Data#026 - André Sionek - Fullstack dos dados: da Engenharia até o DataVizNeste episódio conversamos com André Sionek, Lead Software Engineer na Util. Ele trabalhou durante muitos anos como Data Engineer, é um grande programador em Python, já venceu alguns challenges do Kaggle e foca seu trabalho em desenvolver soluções para processamento de dados escaláveis. Outra área em que se destaca é Dataviz e Storytelling! Por isso, conversamos muito sobre esse tema. Também falamos sobre Kaggle, sobre a esteira de trabalho na área de dados, trabalho no exterior e muito mais! Acesse nosso post para ter acesso a links e referências: https://medium.com/lets-data/
2022-11-0459 min
Data + LoveData + Love - Neil RichardsAuthor and Tableau Visionary (and JLL Colleague) Neil Richards drops in to talk about his new book "Questions in Dataviz", inspiration, and the upsides of making pointless dataviz.
2022-11-0238 minThe Elevate Data Visualization Show#5 Creating a Killer DataViz Portfolio: Tips and TricksIn this week's episode of the Elevate Dataviz Show, we share our top tips to building a portfolio of dataviz projects when you don't have an employer or clients! Should you do a personal project or reach out to a non-profit? Should you work for free? We share what worked for us and more.
2022-11-021h 01The Elevate Data Visualization Show#4 Are Data visualization Awards Useful? A debate - Elevate Data Visualization ShowIn this episode, we explore the merits of dataviz awards. What value do they bring? What are the pitfalls? What's a good alternative?
2022-10-191h 05
The PolicyViz PodcastPieta Blakely and Eli Holder on Data EquityPieta Blakely, PhD helps mission-based organizations measure their impact so that they can do what they do well. She started her nonprofit career as a teacher in workforce development and adult basic education. It was important work and she was worried that they didn’t really know if they were doing it well. In the process of trying to answer that question, Pieta got a Masters in Education and a PhD in Social Policy, and became an evaluator.Pieta has been an evaluator for over fifteen years, the past five of those as a consultant helping mission-based or...
2022-10-1132 minThe Elevate Data Visualization Show#3 DataViz Roles and Titles: A Beginner's Guide with Zan ArmstrongIn this episode, we explore what we call ourselves (dataviz designer? dataviz engineer? information design specialist??) and why it matters. This topic was inspired by Zan Armstrong's slack post, and she joins us on the show today to share her perspective.
2022-10-0555 minOn the Evidence80 | Lessons from Contact Tracing During the PandemicThis episode of On the Evidence explores lessons from contact tracing for COVID-19 that should inform current and future efforts to rebuild the public health field, particularly its workforce, after the public health emergency ends.
This episode features the following guests:
• Elinor Higgins, a policy associate at the National Academy for State Health Policy
• Shelley Fiscus, a pediatrician and senior policy consultant at the National Academy for State Health Policy
• Rachel Brash, a strategist in the Mayor’s Office of Employment Development who helped oversee the Baltimore Health Corps Initiative
• Shan-Tia Danielle, who worked as a contact tracer and led a team of...
2022-10-0548 minThe Elevate Data Visualization Show#2 Data Viz Experimentation: Out-of-the-box Ideas for Visualizing Data (Part II)In this episode, Gabby and Alli share what they're experimenting with right now and how they're integrating it into their work.
2022-09-2159 minThe Elevate Data Visualization Show#1 Data Viz Experimentation: Out-of-the-box Ideas for Visualizing Data (Point I)Welcome to the inaugural episode of the Elevate Dataviz Show featuring Alli Torban, Duncan Geere, Gabrielle Merite, and Will Chase. In this episode, we share what we're experimenting with right now and how we're integrating it into our dataviz practice.
2022-09-1349 minThe PolicyViz PodcastNew DataViz Learning Opportunity: Elevate Your DataViz TeamOn this week's episode, I chat with the four founding members of the new data visualization mentorship community, Elevate Your DataViz.The post Episode #213: Elevate Your DataViz Team appeared first on PolicyViz.
2022-03-0844 min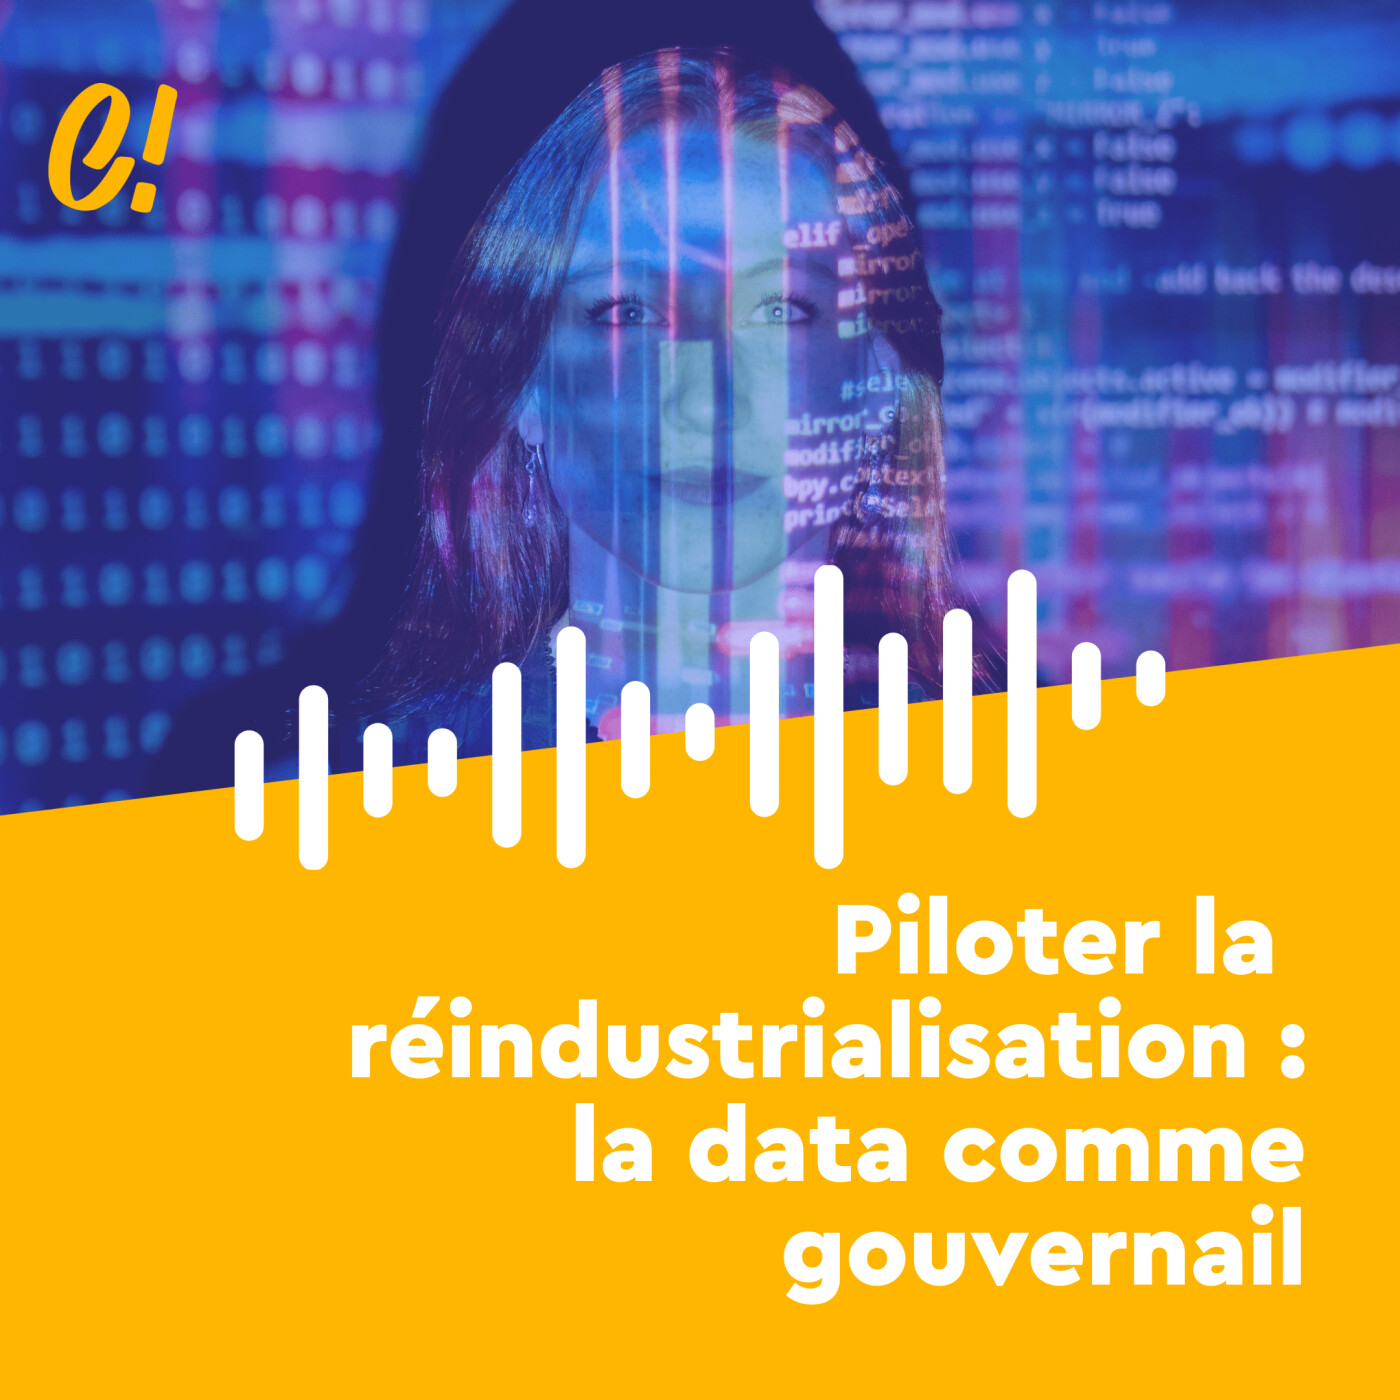
Les articles sonoresPiloter la réindustrialisation : la data comme gouvernailLancé en 2020, le service Dataviz Territoires d'industrie pourrait devenir une pierre angulaire dans la stratégie de réindustrialisation de la France. Croisement de données collectées auprès de différentes institutions, cartographie des sites industriels en friche, définition de nouveaux indicateurs adaptés aux défis actuels : la datavisualisation offre une palette d’outils pour comprendre les besoins industriels nationaux et locaux.
Envie d’en savoir plus ? Rdv sur le blog de la Caisse des Dépôts.
Article : Julien Lec'hvien
Voix : Matteo Bisicchia
Mixage : Théodore Ravat
2022-02-0214 min
Data Viz Today71: Demystifying the Freelance Dataviz ProcessJoin the Elevate Membership Program! I invited a few of the best dataviz designers and freelancers I know on the show today (Duncan Geere, Gabrielle Merite, and Will Chase) and we absolutely stuffed the hour with as many dataviz freelancing tips as we possibly could! In this episode, we demystify the whole process: starting from when someone emails you that they're interested in your work, what you should write back, what you should ask in the discovery call, basics to include in your contract, tips on how to price your work, tools we use to...
2022-01-111h 08
L'Avant-GareData4Change | Les lois de la perception visuelleQui n'a jamais rêvé d'une baguette magique 🪄 pour transformer ses tableaux Excel en beaux graphiques compréhensibles ?
La magicienne qui tient cette baguette, c'est Evelina, Data Designer indépendante en mission chez Data4Change ! Elle vous donne ses meilleurs conseils de Dataviz, au micro de Guillaume Coulomb. Vous apprendrez dans les nouveaux épisodes de l'Avant-Gare.
🛠️ Quels outils choisir en Dataviz
📊 Comment connecter Google Sheets et Datastudio
🥇 Comment progresser en Dataviz
🎨 Les 7 lois de la perception
Bonne écoute ! 🎧
2021-11-2907 minL'Avant-GareData4Change | Les lois de la perception visuelleQui n'a jamais rêvé d'une baguette magique 🪄 pour transformer ses tableaux Excel en beaux graphiques compréhensibles ?
La magicienne qui tient cette baguette, c'est Evelina, Data Designer indépendante en mission chez Data4Change ! Elle vous donne ses meilleurs conseils de Dataviz, au micro de Guillaume Coulomb. Vous apprendrez dans les nouveaux épisodes de l'Avant-Gare.
🛠️ Quels outils choisir en Dataviz
📊 Comment connecter Google Sheets et Datastudio
🥇 Comment progresser en Dataviz
🎨 Les 7 lois de la perception
Bonne écoute ! 🎧
2021-11-2907 min
L'Avant-GareData4Change | Comment progresser en Datavizualisation ?Qui n'a jamais rêvé d'une baguette magique 🪄 pour transformer ses tableaux Excel en beaux graphiques compréhensibles ?
La magicienne qui tient cette baguette, c'est Evelina, Data Designer indépendante en mission chez Data4Change ! Elle vous donne ses meilleurs conseils de Dataviz, au micro de Guillaume Coulomb. Vous apprendrez dans les nouveaux épisodes de l'Avant-Gare.
🛠️ Quels outils choisir en Dataviz
📊 Comment connecter Google Sheets et Datastudio
🥇 Comment progresser en Dataviz
🎨 Les 7 lois de la perception
Bonne écoute ! 🎧
2021-11-2905 minL'Avant-GareData4Change | Comment progresser en Datavizualisation ?Qui n'a jamais rêvé d'une baguette magique 🪄 pour transformer ses tableaux Excel en beaux graphiques compréhensibles ?
La magicienne qui tient cette baguette, c'est Evelina, Data Designer indépendante en mission chez Data4Change ! Elle vous donne ses meilleurs conseils de Dataviz, au micro de Guillaume Coulomb. Vous apprendrez dans les nouveaux épisodes de l'Avant-Gare.
🛠️ Quels outils choisir en Dataviz
📊 Comment connecter Google Sheets et Datastudio
🥇 Comment progresser en Dataviz
🎨 Les 7 lois de la perception
Bonne écoute ! 🎧
2021-11-2905 min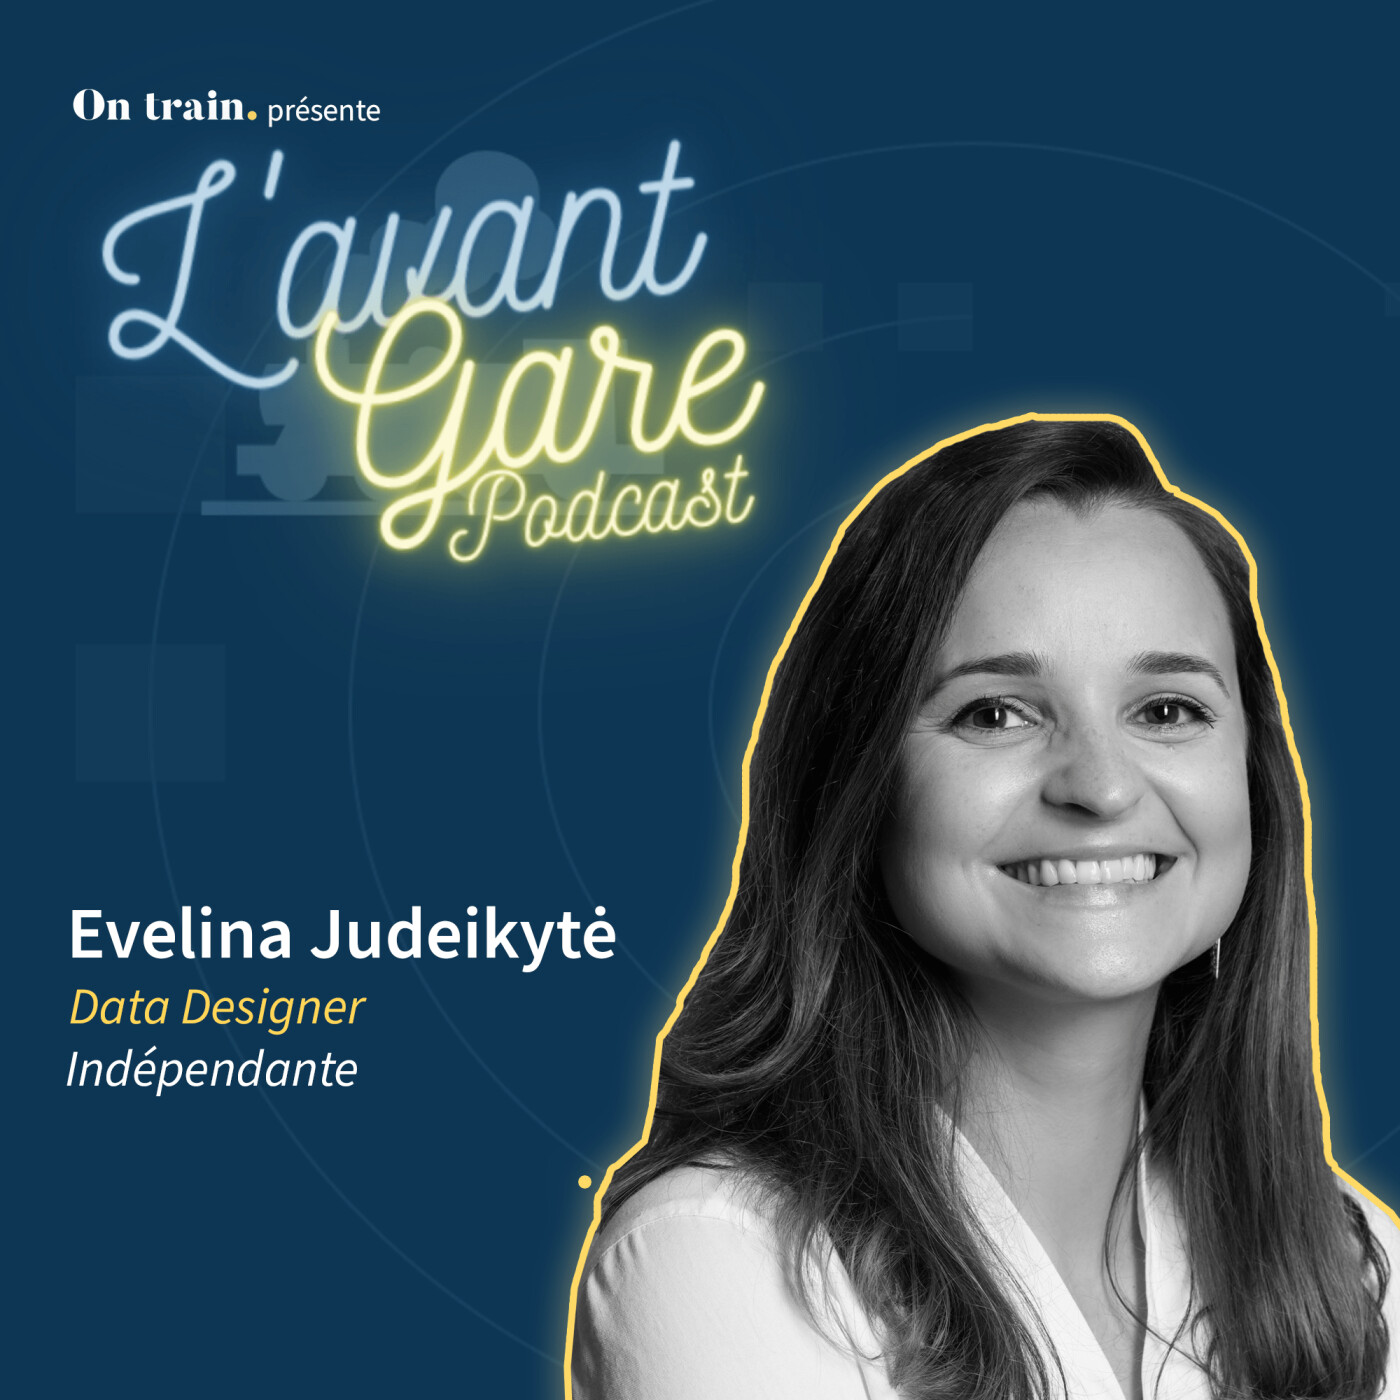
L'Avant-GareData4Change | Connecter Google Sheets à DatastudioQui n'a jamais rêvé d'une baguette magique 🪄 pour transformer ses tableaux Excel en beaux graphiques compréhensibles ?
La magicienne qui tient cette baguette, c'est Evelina, Data Designer indépendante en mission chez Data4Change ! Elle vous donne ses meilleurs conseils de Dataviz, au micro de Guillaume Coulomb. Vous apprendrez dans les nouveaux épisodes de l'Avant-Gare.
🛠️ Quels outils choisir en Dataviz
📊 Comment connecter Google Sheets et Datastudio
🥇 Comment progresser en Dataviz
🎨 Les 7 lois de la perception
Bonne écoute ! 🎧
2021-11-2906 minL'Avant-GareData4Change | Connecter Google Sheets à DatastudioQui n'a jamais rêvé d'une baguette magique 🪄 pour transformer ses tableaux Excel en beaux graphiques compréhensibles ?
La magicienne qui tient cette baguette, c'est Evelina, Data Designer indépendante en mission chez Data4Change ! Elle vous donne ses meilleurs conseils de Dataviz, au micro de Guillaume Coulomb. Vous apprendrez dans les nouveaux épisodes de l'Avant-Gare.
🛠️ Quels outils choisir en Dataviz
📊 Comment connecter Google Sheets et Datastudio
🥇 Comment progresser en Dataviz
🎨 Les 7 lois de la perception
Bonne écoute ! 🎧
2021-11-2906 min
L'Avant-GareData4Change | Quels outils choisir pour le Data Reporting ?Qui n'a jamais rêvé d'une baguette magique 🪄 pour transformer ses tableaux Excel en beaux graphiques compréhensibles ?
La magicienne qui tient cette baguette, c'est Evelina, Data Designer indépendante en mission chez Data4Change ! Elle vous donne ses meilleurs conseils de Dataviz, au micro de Guillaume Coulomb. Vous apprendrez dans les nouveaux épisodes de l'Avant-Gare.
🛠️ Quels outils choisir en Dataviz
📊 Comment connecter Google Sheets et Datastudio
🥇 Comment progresser en Dataviz
🎨 Les 7 lois de la perception
Bonne écoute ! 🎧
2021-11-2908 minL'Avant-GareData4Change | Quels outils choisir pour le Data Reporting ?Qui n'a jamais rêvé d'une baguette magique 🪄 pour transformer ses tableaux Excel en beaux graphiques compréhensibles ?
La magicienne qui tient cette baguette, c'est Evelina, Data Designer indépendante en mission chez Data4Change ! Elle vous donne ses meilleurs conseils de Dataviz, au micro de Guillaume Coulomb. Vous apprendrez dans les nouveaux épisodes de l'Avant-Gare.
🛠️ Quels outils choisir en Dataviz
📊 Comment connecter Google Sheets et Datastudio
🥇 Comment progresser en Dataviz
🎨 Les 7 lois de la perception
Bonne écoute ! 🎧
2021-11-2908 min
Data VoorstellingenAndy Kirk – Our Master of Dataviz!Our first English guest is one of our heroes in the field of dataviz. Right after he returned from his sabbatical, we had the opportunity to talk with him. In this episode of the podcast, we have a conversation with Andy Kirk.We talked with him about:- how he discovered dataviz as a career,- his studies (University and a Master in Dataviz!),- his career (since 2011 a free-lancer as Dataviz specialist),- his books (Data Visualisation and the Seinfield Chronicles),- his hobbies (Seinfeld, Liverpool...
2021-10-071h 12
Electro MonkeysL'art de la Dataviz avec Victor BaissaitOn entend souvent dire que les données sont le nouveau pétrole. Pourtant, certaines de ces données ont besoin d'être représentées pour être compréhensibles et interprétées. La visualisation de données, plus communément appelée dataviz est l'ensemble des méthodes qui servent à représenter ces données.
C'est un domaine très particulier qui allie la créativité de l'artiste à la rigueur du mathématicien. Cependant la dataviz a deux visages : celui qui permet d'éclairer un jeu de données en nous le rendant compréhensible, et celui qui manipule ces...
2021-09-221h 01
Splice Lo-FiThibi's founder Yan Oak on dataviz trends and data journalism business modelsToday we've got our good friend Yan Oak, founder of Thibi — a data visualization startup based in Singapore. Yan and his team are among the best dataviz folks in the region. We've worked with them on projects in the past and we love the dedication of this crew. We spoke about where dataviz is headed, and what interesting data journalism business models could come out of it.More on Thibi:https://thibi.co/Follow Yan on Twitter:https://twitter.com/yanoak
2021-09-1029 min
Data VoorstellingenNadieh Bremer – op rollerskates van Sterrenkunde naar Dataviz SuperSterMet Nadieh praten we over haar tijd op het VWO en hoe ze tot de keuze is gekomen om van Almelo naar Leiden te verhuizen om daar Astronomie & Kosmologie te gaan studeren.We vragen natuurlijk ook naar haar carrière-stappen, ze is gestart bij Deloitte, daarna naar Adyen gegaan om in 2017 de stap te maken als freelancer.Eerder dit jaar heeft ze samen met Shirley Wu het boek ‘Data Sketches’ uitgebracht. We vragen hoe het idee ontstaan is om dit boek te maken en wat er allemaal komt kijken om zo’n prachtig boek te maken...
2021-08-3155 minData + LoveData + Love - Creativity in Dataviz w/ Nataliia PoiarkovaI sit down with University of Queensland Graduate student Nataliia Poiarkova to talk about creativity in Dataviz, why it matters, and when to use itSupport the show (https://ko-fi.com/datapluslove)
2021-08-1131 min
The Tableau World PodcastEP231 - Accessibility In DataViz with Frank ElevaskyIn this episode of the Tableau World Podcast, Emily talks with Frank Elevasky on accessibility in dataviz, the Chartability tool, and his three wishes. Check out Chartability, a tool to help you determine the accessibility of a viz, by going to: https://chartability.fizz.studio/ Follow Frank at: https://twitter.com/frankelavsky?lang=en
2021-05-1948 min
Data VoorstellingenMaarten Lambrechts - Freelance Datavisualization Consultant: Van Agricultuur via xenographphobia tot Dataviz RockstarIn deze 10de episode van Data Voorstellingen spraken we met Maarten Lambrechts, zeer actief op twitter, jurylid bij Malofiej en prijswinnaar met zijn visualisaties. Een echte Dataviz Rockstar.Zijn naam viel al in het vorige gesprek met Daan Louter door zijn blogpost bij Flourish over connected scatterplots. Maar Maarten stond daarvoor al op onze lijst omdat hij een zeer gerenommeerde naam is in de dataviz-wereld, niet alleen in België en Nederland.Hij studeerde Forestry & Nature Conservation in Leuven, is daarna gestart als Agricultural Economist in Bolivia. Is daarna aan de slag gegaan als Project Coörd...
2021-05-0841 min
Data VoorstellingenDaan Louter - Head of Product bij Flourish: Met Scrollytelling van school naar de Guardian en door naar FlourishIn deze 9de episode van Data Voorstellingen spraken we met Daan LouterVeel van de dataviz producten zijn gebaseerd op dezelfde aanpak. Maar er zijn ook partijen die het fundamenteel anders proberen aan te pakken. Een voorbeeld hiervan is Flourish uit Engeland. En daar werkt dan ook nog een Nederlander, namelijk Daan Louter. Die moesten we natuurlijk spreken...We hebben het met hem over zijn opleidingen en zijn loopbaan. Hij vertelt welke geweldige aanpak hij heeft gebruikt om binnen te komen bij een gezaghebbende krant als de Guardian, echt fantastisch! We praten ook over wat hi...
2021-04-2147 min
AI or DIE72. Dashboards sind keine Schweizer Taschenmesser - DataViz Guideline - Streaming - SeminaraufbauAndreas und Kai sprechen über Seminargestaltung, die Notwendigkeit einer DataViz Guideline und die Vorteile des Streamings.
Hier geht's zu den genannten Seminaren
Dashboarding und Data Vizualization für Controllerinnen in PowerBI oder SAP Analytics Cloud
Du findest gut, was wir machen?
Werde Teil unserer Community - Alle generierten Einnahmen werden an die Stiftung Bildung gespendet.
Bitte gebt uns Feedback!
Hat euch die Folge gefallen? Dann gebt uns gern eine kurze iTunes-Bewertung !
Welche Fragen sollen wir demnächst stellen? Welche Interviewpartner möchtet ihr gerne hören?
Schreibt uns gern eine E-Mail an info...
2021-04-2137 min
The Flares - Podcasts# 22 Fake news et pouvoir des réseaux sociaux – Avec Victor Baissait | The Flares⚠️ Découvrez du contenu EXCLUSIF (pas sur la chaîne) ⚠️ ⇒ https://the-flares.com/y/bonus/
⬇️⬇️⬇️ Infos complémentaires : sources, références, liens... ⬇️⬇️⬇️
Le contenu vous intéresse ?
Abonnez-vous et cliquez sur la 🔔
Vous avez aimé cette vidéo ?
Pensez à mettre un 👍 et à la partager.
C'est un petit geste qui nous aide grandement 🥰
⚠️ Essayez GRATUITEMENT "The Flares Premium" ⚠️ ⇒ https://the-flares.com/y/premium/
-----------------------------------------------------------------
✍️ QUI EST DERRIÈRE CE CONTENU ? ☕
➡ Production : The Flares - https://the-flares.com
➡ Realisation : Gaëtan Selle - https://www.the-flares.com/y/gaetan-selle/
➡ Animateurs : Gaëtan Selle - https://www.the-flares.com/y/gaetan-selle/
-----------------------------------------------------------------
🌎 SUIVEZ-NOUS 🌎
💬 Communauté : https://the-flares.com/y/communaute
🐦 Twitter : http...
2021-04-172h 51
AI or DIE66. The DataViz Design Process - Talking with Andy Kirk, Visualising Data | ENAndy, Viktoria, and Kai on using the DataViz Design Process in everyday business practice.
Mentioned in today's episode:
Andy Kirk
Visualising Data
Visualising Data on Twitter
Academic project 'Seeing Data’
Mentioned Tools
RAW Graphs
Flourish
Please give us feedback!
You liked this episode? Then please give us a quick iTunes-review !
Which questions should we ask next? Which interview partners would you like to hear?
Please write us an email info@reportingimpulse.com, via
Twitter or get in direct contact with us!
Get in contact:
Kai-Uwe Stahl
Viktoria Hell
Instagram | Twitter | LinkedIn...
2021-03-2449 min
data:unplugged#57 HeadsOfData #48 mit Moritz Stefaner | Truth & Beauty OperatorMoritz ist eine Koryphäe auf dem Gebiet der Datenvisualisierung und teilt dazu immer wieder spannende Insights.
TRUTH AND BEAUTY: https://truth-and-beauty.net/
Data Stories Podcast: https://datastori.es/
Peak Spotting: https://truth-and-beauty.net/projects/peakspotting
Spotti: https://nand.io/projects/spotti
Salesforce Deep Learning UX: https://truth-and-beauty.net/projects/sf-dlux
Artikel "There be dragons: dataviz in the industry": https://medium.com/visualizing-the-field/there-be-dragons-dataviz-in-the-industry-652e712394a0
LinkedIn Moritz: https://www.linkedin.com/in/moritzstefaner/
LinkedIn Bernard: https://www.linkedin.com/in/bernardsonnenschein/
Feedback z...
2020-12-301h 15
Data Storiessvelte.js for web-based dataviz with Amelia WattenbergerThis week, we are joined by Amelia Wattenberger, journalist-engineer at the Pudding and book author. We discuss the exciting Svelte framework for web development, which is especially well suited for developing interactive data visualizations. Hear how it compares to other frameworks like react, why web development nowadays seems so complicated, and finally, hear a few ideas for last minute dataviz-related present ideas for the holiday season
Links
Svelte tutorial
svelte.recipes
Svelte Radio
Mathias Stahl: How you setup data visualization with Svelte
Layercake
“I am a book. I am a portal to the universe.”
Pilot G-Tec C4
...
2020-12-1447 min
WealthVest: The Weekly Bull & BearS2E25: NYSE to Reopen and the FED Buys ETFsIn this episode Grant and Drew discuss the NYSE's partial reopen, the $48 billion in unemployment insurance last month, the potential of future legislative relief, possible tax increases, 1/4 of restaurants at risk of going out of business, Jerome Powell on contraction, the FED's purchase of ETFs and how the poorest U.S. households have been affected by the Corona virus.WealthVest – based in Bozeman, MT, and San Francisco, CA – is a financial services marketing and distribution firm specializing in fixed and fixed index annuities from many high-quality insurance companies. WealthVest provides the tools, resources, pract...
2020-05-2029 minThe PolicyViz PodcastEpisode #170: DataViz in the Time of COVIDAs the world hunkers down to slow the spread of the coronavirus, a lot of information is making its way to our information channels. Some of this information is true, some is false, and some is misleading in one way...
The post Episode #170: DataViz in the Time of COVID appeared first on PolicyViz.
2020-03-1855 min
Wrong, But UsefulWrong, But Useful: Episode 77
In this month's Pi Day Special episode, we're joined by @aap03102, who is Chris Smith in real life. We discuss:
Negative primes
Surdoku (look in issue $2^5$)
Chris's dark past
Chalkdust book of the year
Book (or writing) ideas (I’m trying to compile a big list of maths things I - or anyone - could write about. If you have such an idea, let me know and I’ll stick it on the list.)
Chris's Pi Day antics
Katherine Johnson has died, aged 101
A COVID-19 lesson plan and dataviz.
Distance-time graphs
* Edited 2020-03-14: To subscribe to Chri...
2020-03-131h 22
Visual+menteV+M#139 - O legado de Burle MarxNo programa de hoje, Ancara, Ricardo e Diego recebem Roseli D'Elboux, professora de arquitetura da Universidade Presbiteriana Mackenzie e Fred Gelli, co-fundador e CEO da Tátil Design, para conversar sobre Roberto Burle Marx e a sua influencia no design.
7:40 Início do programa
Links da introdução
Dataviz.rio
https://www.facebook.com/dataviz.rio/
Café
http://cafe.art.br/
Links do programa
Calçadão de Copacabana
http://agenciabrasil.ebc.com.br/sites/default/files/atoms/image/963237-11092015%20-%20exposicao%20pedras%20portuguesas1%20-%2011.jpg
Recife de Burle Marx
https://curiosamente.diariodepernambuco.com.br/project/o-recife-de-burle-marx/
Sitio Burle Marx
https...
2019-12-121h 16
devMode.fmExploring Data Visualization with d3.js
On this episode, we talk with Amelia Wattenberger, a frontend & UX developer at Parse.ly about data visualization aka dataviz.
We discuss the origins of dataviz, and how it can be used to tell a narrative with the immediacy and visceral connection that can be difficult to do with other mediums.
We discuss Amelia’s personal approach to dataviz, and discuss the d3.js library at length. d3.js is a broad library of modules that you can use as a dataviz construction kit, and we discuss how to get starting doing just that!
d3...
2019-11-2500 min
Les voix du Digital : Explorateurs du numériqueBI et Dataviz : des chiffres et des lettresPour cet épisode, Alain Garnier se penche sur le marché de la Business Intelligence (BI) et sur le principe de Datavisualization (Dataviz).
2019-08-1205 min
go Beyond the DataEp 27 - How Caroline & Sara are building a dataviz community in PortugalHow Caroline & Sara are building a dataviz community in Portugal
2019-06-1141 min
The Present Beyond Measure Show: Data Storytelling, Presentation & VisualizationThe Best Data Storytelling Advice I’ve Ever Gotten with Scott BerinatoScott Berinato is the author of “Good Charts,” where he helps people turn their plain or uninspiring charts into visualizations that clearly convey ideas powerfully. This book has quickly rose the ranks of my top-recommended data storytelling and visualization reads for anyone who presents data.He is a self-described “dataviz geek” and Senior Editor at the Harvard Business Review. He created the successful “Vision Statement” department in the magazine, has written and edited many articles for HBR and other top business and tech-related print and web publications.In this episode, Scott breaks down the most important co...
2018-08-081h 06
For the Love of DataE030 – July 2018 News RoundupJuly 2018 News Roundup
This month’s episode is a roundup of news from a variety of sources covering three main topics:
BI / Dataviz Tools
Databases and Platforms
Tools and Frameworks
Note: Most of the text extracts below are direct quotations from new sources cited in the source list at the bottom of these show notes. This episode is a compilation from those sources.
BI / Dataviz Tools
PowerBI enhancements (7/12/18)
Microsoft has updated its Power BI analytics service in an effort to expand data prep capabilities and unify da...
2018-07-3115 min
storytelling with data podcaststorytelling with data: #1 the art of feedbackFeedback is a critical component for refining and perfecting data visualization. In this first episode, Cole discusses both the value of giving and receiving dataviz feedback and potential problem areas to avoid. Hear The Economist’s response to the recent hurricane data visualization challenge as well as answers to reader questions on the topics of when to use graphs, considerations with dashboards and dataviz 101 book resources. Be sure to subscribe and write a review if you like what you hear! Mentioned show links: Feedback? email feedback@storytellingwithdata.com Blog post: SWD makeover challenge on Th...
2017-11-2833 min